
|
Getting your Trinity Audio player ready...
|
Trend Lines are nothing but straight lines plotted on a chart to confirm the occurrence, end or validity of a trend. This is one of the effective methods for identifying trends. Usually, we follow the trend line to determine the maximum deviation of prices from a fixed range, which is defined by the trend line. However, at times, trend lines may be difficult to define due to irregular patterns in the market, which is why one must also apply some common sense or use other indicators to identify trends. Just like any concept in TA, Trend Lines are not permanent indicators and must be followed until a change or break in trend occurs.
Formation of Trend Lines
Uptrend
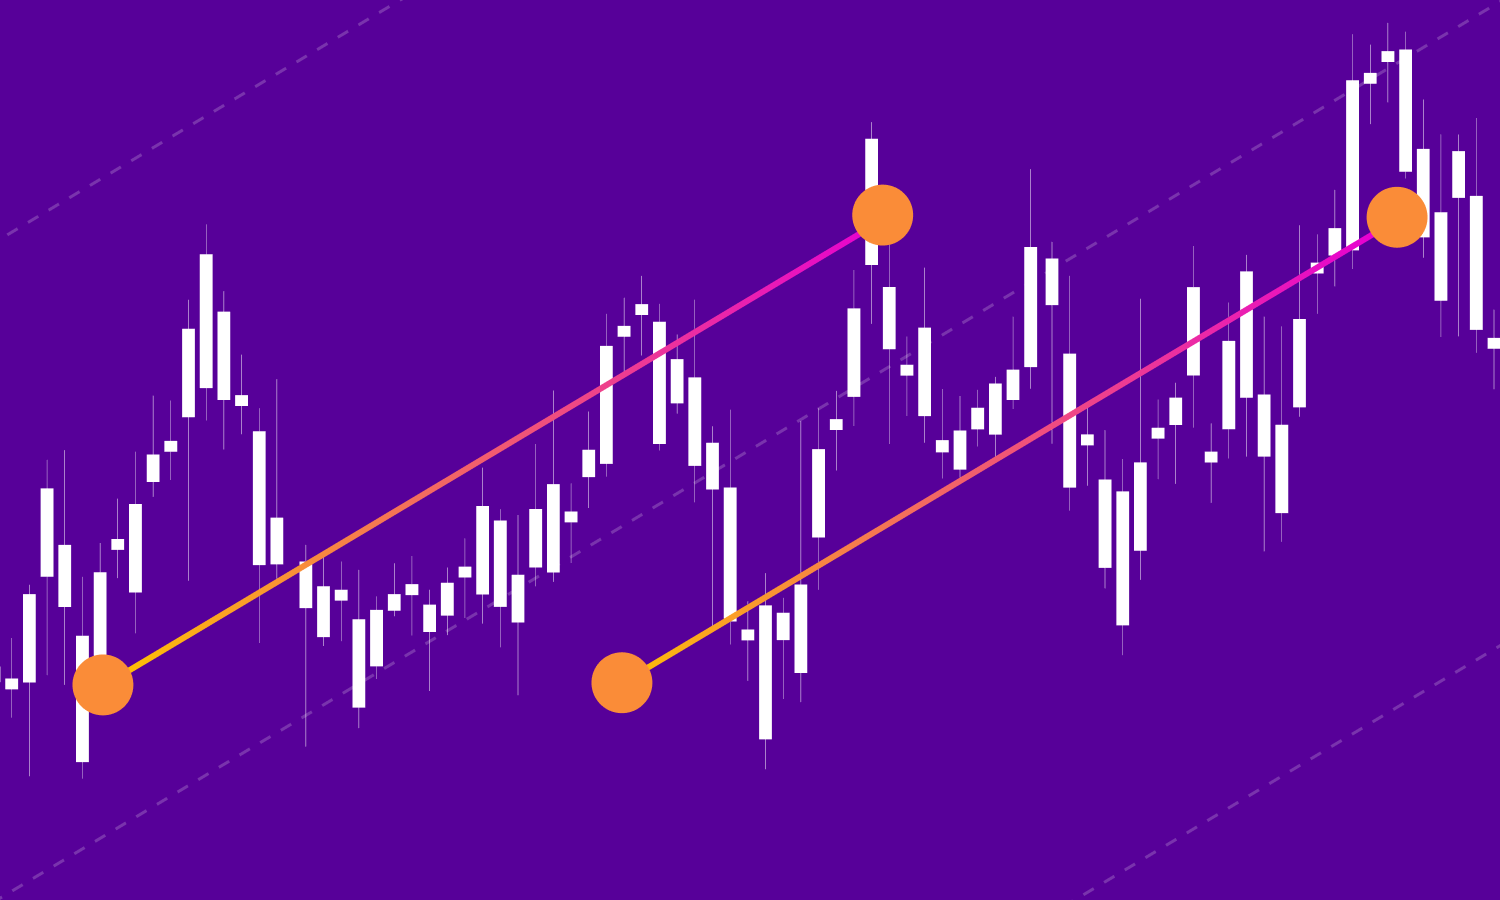
A trend line to mark an uptrend is drawn by joining the troughs or swing lows of consecutive candlesticks. Have a good look at the chart below:
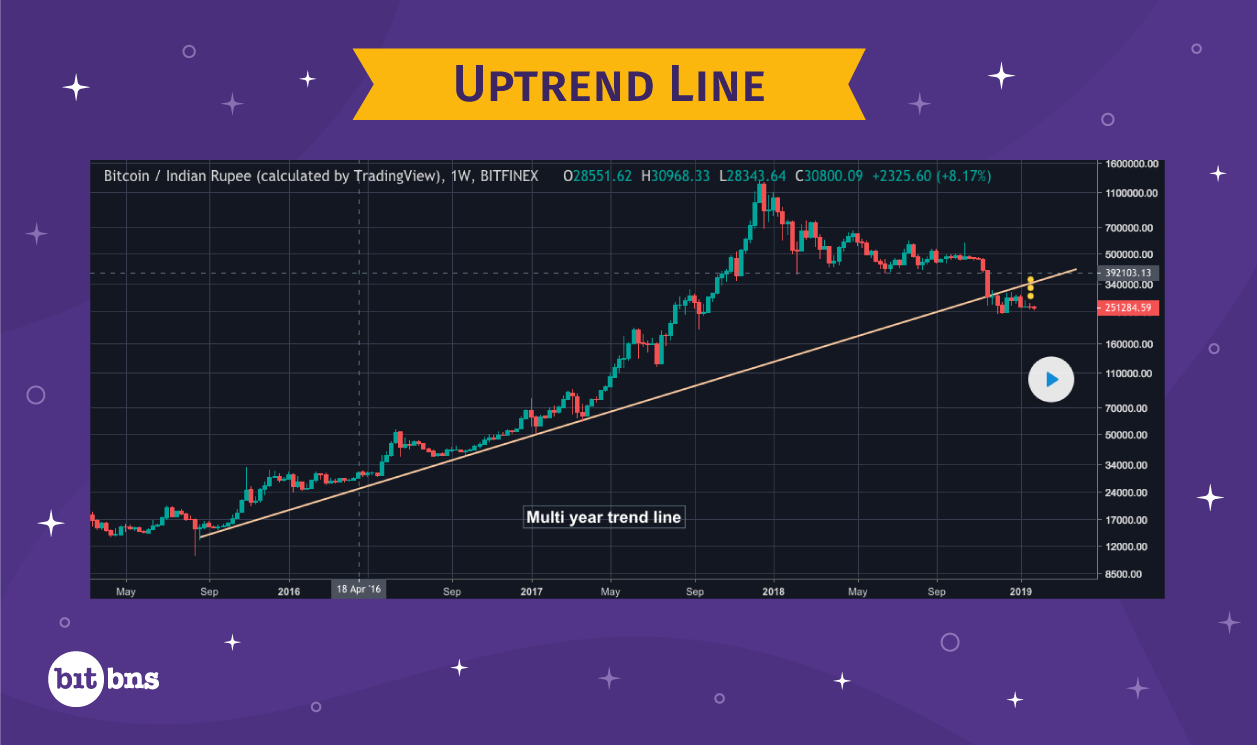
As you can see, a rising straight line has been drawn clearly touching two troughs and slightly missing the third trough. This brings us to the criteria that must be satisfied while drawing a trend line for an uptrend:
- The line must touch the extremes of the first two troughs with fair accuracy. Refer to Point 1 and Point 2 in the figure.
- The third trough touch may be approximate. Refer to Point 3 in the figure. The line touching the third trough is also considered confirmation for the trend line.
- The line formed must be straight till the point that represents break in trend.
- The trend line could be touching a low or close; both count.
Downtrend
The trend line representing a downtrend is drawn by joining the peaks of the consecutive candlesticks. Here’s a chart that shows a trend line representing a downtrend.
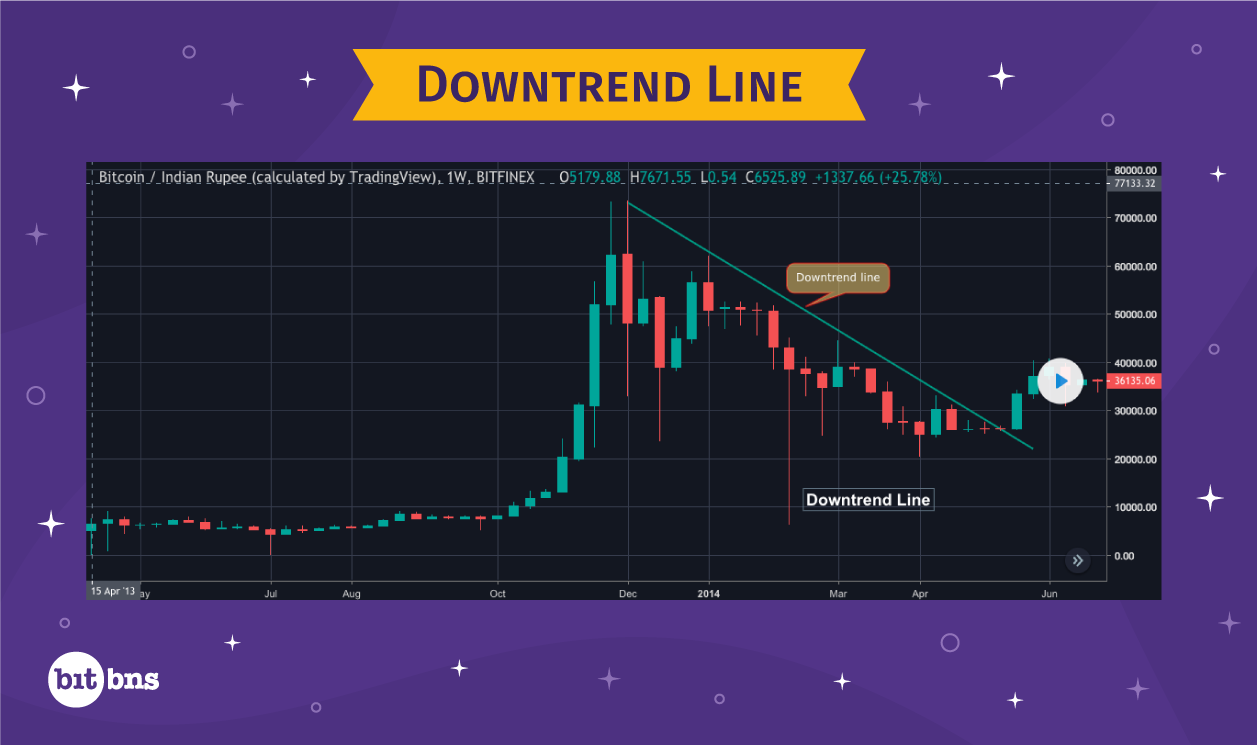
In the figure, it is apparent that the line touches three major points, among which the third touch is approximate. Let us now look at the criteria for drawing a trend line representing a downtrend:
- The line must touch the extremes of the first two peaks with fair accuracy. Refer to Point 1 and Point 2 in the figure.
- The third peak touch may be approximate. Refer to Point 3 in the figure. The line touching the third peak is also considered the confirmation for the trend line.
- The line formed must be straight till the point that represents break in trend.
- The trend line could be touching a high or open; both count.
How to identify a break in Trend Line

Identifying a break in trend line also demands the determination of how much deviation from the trend line is allowed. Hence, we will look at two things here:
- Deviation Tolerance
- Break in Trend
Deviation Tolerance
A tolerance of a few candles (0-4 approximately) is acceptable. If you are still not sure whether it’s a break or a false breakout, try expanding or shrinking the timeframe for better insights.
Break
To understand better, we will look at a chart of an uptrend.
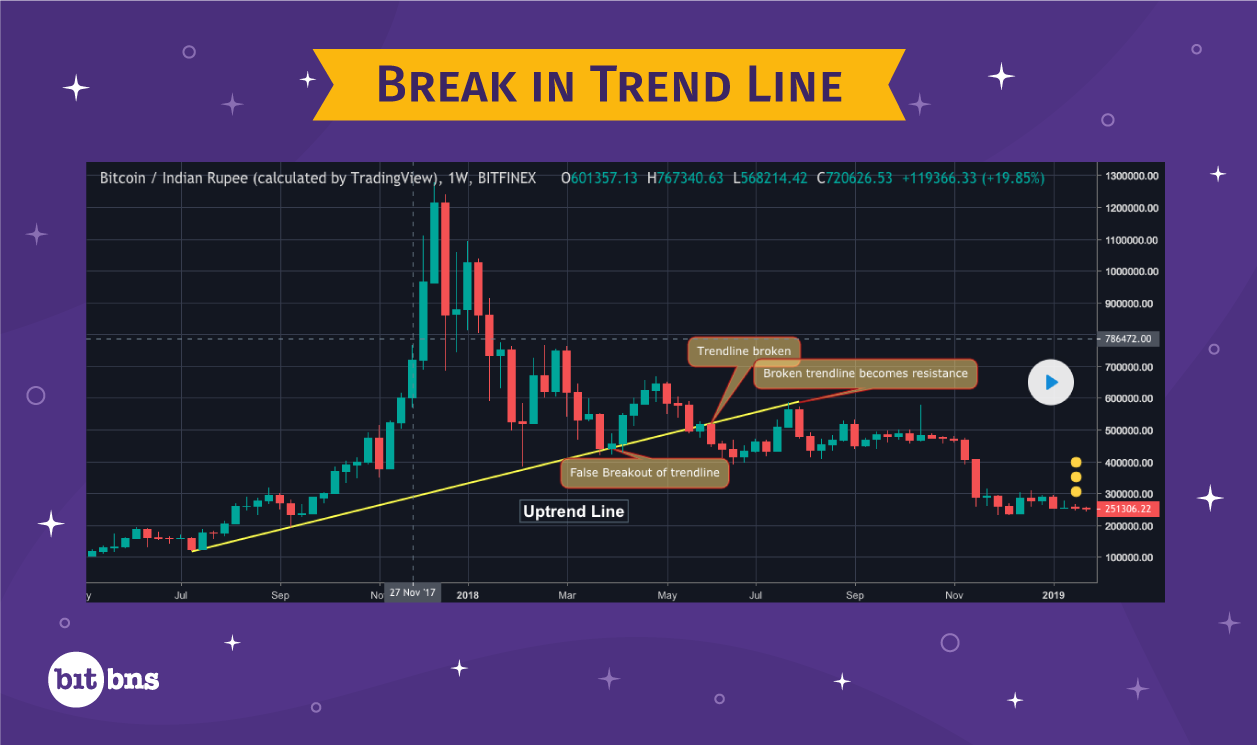
The area circled shows that the prices went well below the trend line, and have been accepted in that zone as there are multiple candlesticks that show a fall in the price, especially the last candlestick that clearly shows acceptance. Hence, this event on the chart would be considered a clear reversal.
Significance of Trend Lines
Direction
One of the major utilities of trend lines is that one can predict the direction of the market, or simply, trend. A trend line rising up shows uptrend, whereas a trend line sloping down represents downtrend.
Angle of Slope
The angle of slope speaks volumes about how aggressive a trend is. Steeper the slope, the more aggressive the trend. However, the angle of slope is also inversely proportional to the reliability of a trend. A trend with a very steep slope may break as quickly.
Length
Length also represents the reliability of a trend line. In the same chart, you can have multiple trend lines for the same uptrend, by drawing them for different timeframes.
Here we already had a trend line representing uptrend, and we drew another for a more recent trend. Both are completely fine to exist in the same chart. Upon comparing the lengths of the trend lines, we find that the line L1 is longer than L2. Hence, L1 is more reliable than L2 as its integrity has been proven over a longer period of time.
Number of Touches
The more the number of touches a trend line makes, the more it can be trusted. Each point the trend line touches, confirms that the trend is in continuation and keeps ambiguity off the charts.
When Trend Line doesn’t touch candles anymore
Sometimes, even though the trend goes on, the trend line does not touch price points on the chart, which does worry some of the traders. In this case, what you can do is let the existing trend line stay in place, and draw a new trend line that adjusts according to the price points. Keeping both the trend lines in the same chart is fine.
In case you can’t read the trend line because the market has been fluctuating a lot, try expanding the timeframe of the chart. Along with that, use other methods and indicators like peaks and troughs, patterns etc. to match up with the trend line.
Support & Resistance (S/R)
Support & Resistance are defined as levels that prices cannot cross, and reverse when contact happens, until the levels fail. Think Support as the floor and Resistance as the ceiling. Inside a room, the floor is the lowest point that you can reach and the ceiling is the highest. The primary role of S/R is to predict the price movement as it is believed that the price of an asset will trade in a similar fashion in future, unless there is a break in S/R level.
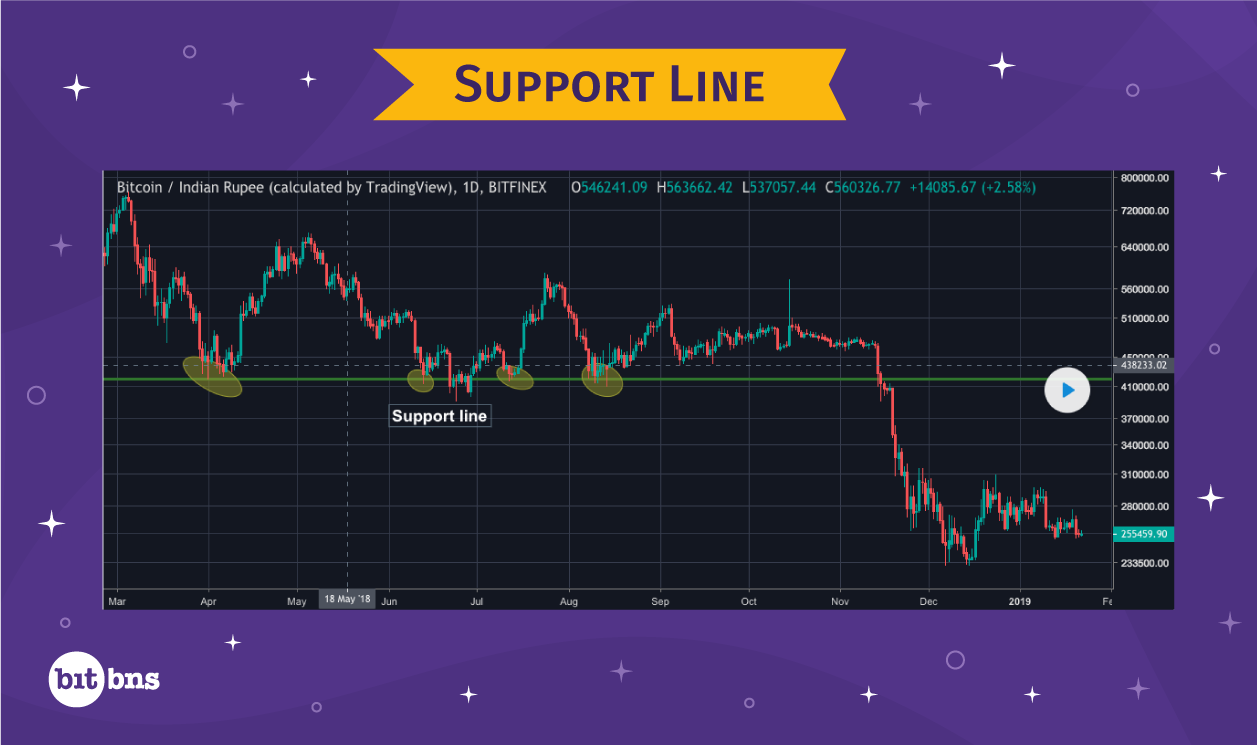
Support
The term comes from the support that the support level provides to the price when they fall, which means the price retraces when it reaches the support level. When the price rallies downwards and reaches the support level, there is a high demand for the asset as the prices bounce back from the support level. Hence, price reaching the support level calls for a buying opportunity.
There are times when support levels are breached and price falls till a new support level is defined.
Have a look at the chart to understand better.
Resistance
The simplest way to define resistance is that it is the level that resists prices from going further up. Just like in support, prices tend to retrace upon contacting the resistance level, until they breach it and rally up to find a new resistance level. When the prices rally up and reach the support level, the selling pressure is high. Hence, prices reaching the support level call for a buying opportunity
Two different resistance levels have been shown in the chart below:
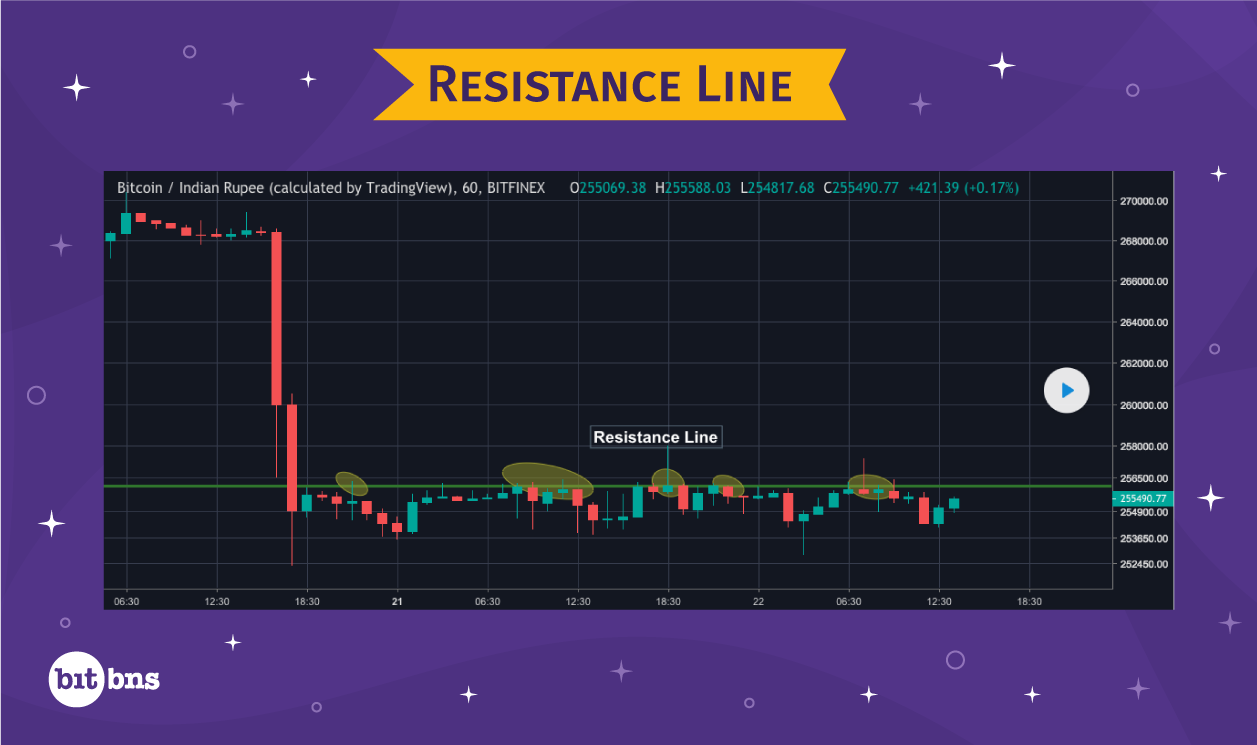
Notice how prices tend to retract when they touch the resistance level R1. Further into the timeline, prices breach the level R1 and continue to create new highs until they comply with the new resistance level R2.
Concept of Polarity in S/R
In Technical Analysis, once breached, support becomes resistance and resistance becomes support.
Support becomes Resistance
The major takeaway in this chart is how the support level started acting as resistance, once it was breached.
Resistance becomes Support
Once the prices cross the resistance level, the line representing the resistance continues to act as a support for the new price movement.
How to draw S/R levels in a chart
Following are the criteria for drawing S/R levels:
Support
- Level is drawn below the current price.
- Minimum 2 swing lows (also called troughs) are required. The more the better. Essentially, the lows must show a hesitance from dipping further below an approximate level.
- Join the 2 swing lows forming a straight horizontal line.
Resistance
- Level is drawn above the current price
- Minimum 2 swing highs (also called peaks) are required. The more the better. Essentially, the highs must show a hesitance from moving further above an approximate level.
- Join the 2 highs forming a straight horizontal line.
Significance of S/R
Imagine a scenario where you know that the support level, for coin A, is defined at Rs. 85 and the resistance level is defined at Rs. 125.
You know that due to resistance at Rs. 125, price of coin A would not cross Rs. 125 and rather bounce back.
Similarly, you know that due to support at Rs. 85, price of coin A would not breach Rs. 85 mark and rather retrace from that price point.
These levels can be used to determine the type of trade position you want to assume. If the price is somewhere around the resistance, you can take a short position and sell coin A when the price retraces. Likewise, when the prices are hovering around the support level, you can take a long position by purchasing coin A around Rs. 85, and selling them off at higher prices when the market retracts from the support level.
What happens when S/R levels are breached
Either of the two things happen when S/R levels are breached:
Slight break with prices readjusting to comply with the level
At times, a breach may look like an S/R level just failed. But then the prices adjust to follow the level again. This is a temporary break, which may occur many times during the existence of an S/R level. So always wait for confirmation before you change your trading stance.
- S/R level fails
Whenever an S/R level fails, a significant change in prices is imminent. The magnitude of price change depends upon the timeframe that you are observing with. This is generally a good trading opportunity as the change may be a trend reversal or a huge trading opportunity branching out of the huge price change.
Strength of S/R Levels
Multiple factors are examined to determine the strength of an S/R level, which are:
Time
Relevancy is the key parameter to judge any element of technical analysis. In the case of S/R, the time a level has remained relevant is one of the prime indicators of its strength.
Volume
The volumes of assets traded during the existence of an S/R level is a direct sign of its strength.
Recency
Compared to an S/R level that has remained unverified and untested for a long time, a recently formed S/R level is a better indicator of strength.
Technical Tools
Technical tools are the tools that help us read the charts better and are provided by most of the charting software. One can save time and manual effort to draw and apply various indicators by using technical tools.