
|
Getting your Trinity Audio player ready...
|
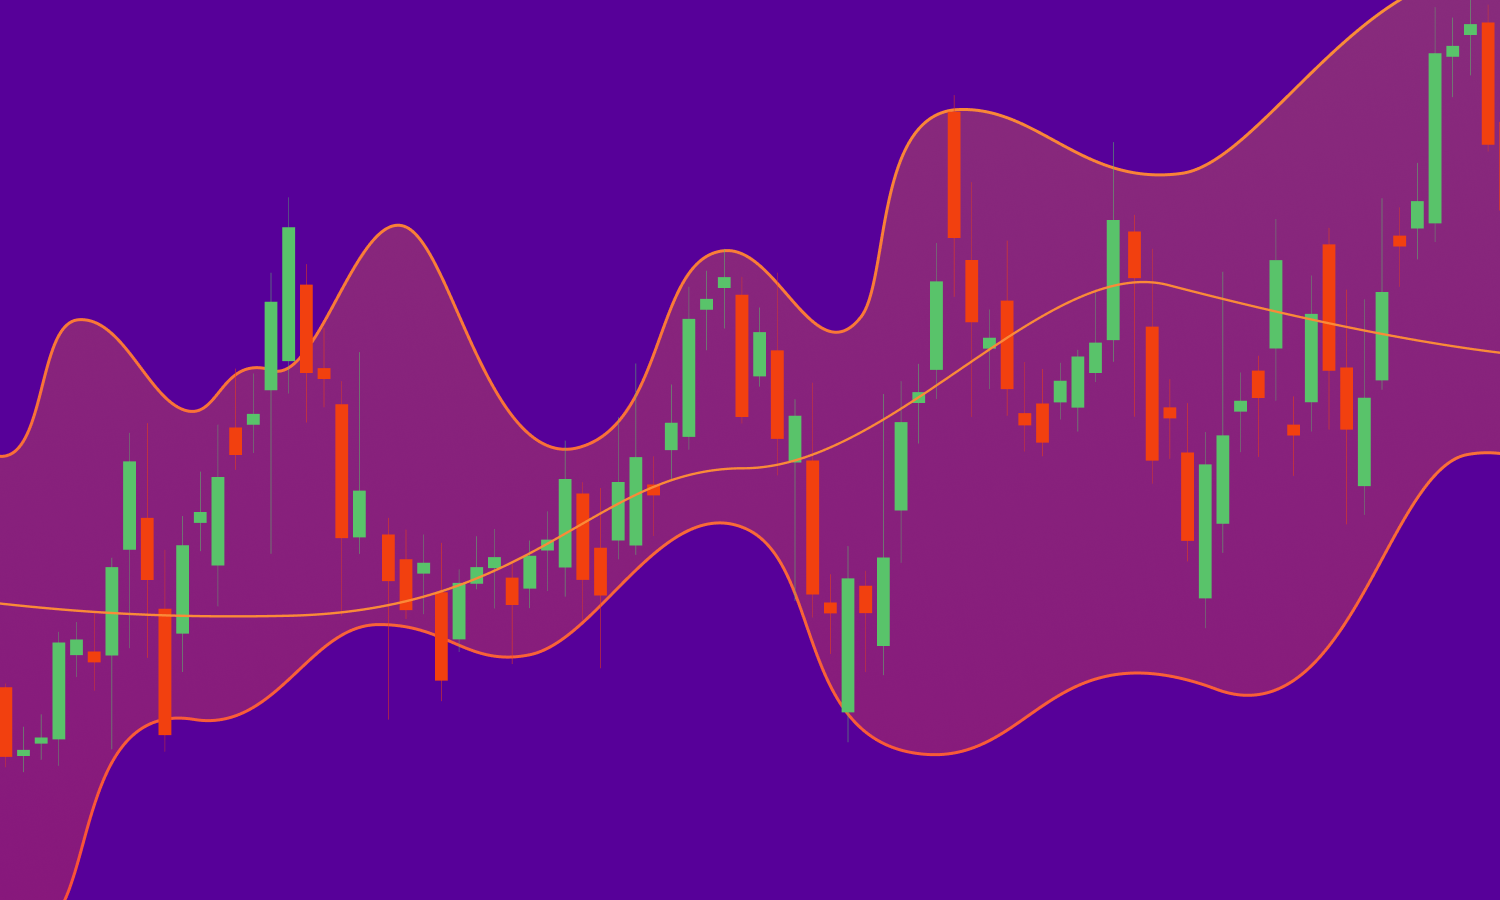
Bollinger Band is an area represented on a trading chart that shows the standard deviation of prices from Simple Moving Average. The significance of using standard deviation from simple moving average is that the trader can predict the direction of the price movements. And since the deviation is both negative and positive, Bollinger Band has an upper end and lower end.
Before we go into details, here’s a chart that shows Bollinger Band:
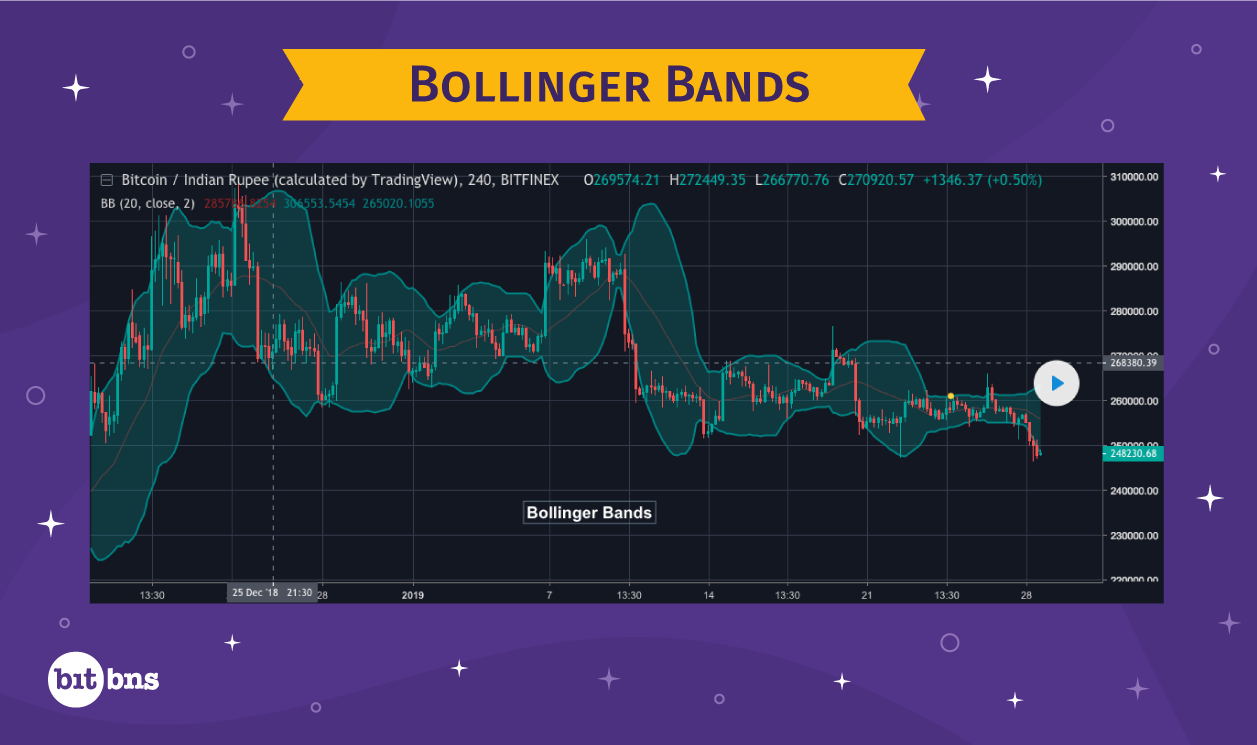
There are four components of Bollinger Band:
- Candles
- Upper end of Bollinger Band
- Lower end of Bollinger Band
- Line of SMA
We already discussed how SMA is calculated, where we talked about simple moving averages in detail. The line running in the middle of the Bollinger Band shows the SMA for particular price points on the chart. The distance between the upper end of the band and the distance between the lower end of the band at any particular point in the chart, is always equal, which is equal to the value of standard deviation or a multiple of the standard deviation.
So, while the upper end of the Bollinger Band is formed by plotting “SMA + Standard Deviation”, the lower end of it is formed by plotting “SMA – Standard Deviation“. And since the value of deviation keeps changing with the change in SMA, the Bollinger Band adjusts itself according to the candle’s formation.
Most of the technical analysts use a 20-Day SMA and second multiple of the value of standard deviation. For example – if the 20-day SMA for Bitcoin is $3,000 and standard deviation is $100, then the standard deviation for upper and lower end of the band is plotted at $200.
I have not explained how standard deviation is calculated because it is mostly a part of statistics. But you need not worry about it because most of the charting tools will allow you to set Bollinger Band, which includes the calculation of standard deviation. Just so that you know why the Bollinger Bands always maintain a distance from SMA, mentioning Standard Deviation was necessary in my opinion.
Significance of Bollinger Band
As nothing guarantees sure-shot identification of trading opportunities in TA, Bollinger Band can only come close to sending out alert signals to traders and analysts. Technical analysts believe that prices move according to the Bollinger Band, and that the band acts as support and resistance levels. It has been observed that prices tend to retract upon touching the upper end of the band or the resistance level and tend to rally up when they touch the lower end of the band or the support level. Thus, in a way, the Bollinger Band indicates the market sentiment.
Relative Strength Index (RSI)
Relative Strength Index is an indicator of the price momentum for a cryptocurrency. As momentum can be a great signal of a continuation or a reversal, RSI is quite popular among traders due to its characteristic of predicting the market in advance. The value of RSI oscillates from 0 to 100, where anything above 70 represents the market is overbought and a correction or decline in prices is probable. Anything below 30 means the market is oversold and a correction or rise in the prices is expected.
Here is the formula for calculating RSI:
RSI = 100 – (100/1+RS)
Where RS = Average Gain / Average Loss
Do not panic if you don’t understand how this formula is going to work. We are just going to learn what RS in the formula means.
Let us say we have the closing price data for the last 14 days. 14 days because the developer of RSI, J. Welles Wilder, recommended RSI to be calculated for 14 periods. Hence, we will follow his footsteps when calculating RSI.
Assume that the price on day 0 was Rs. 100
| Day | Closing Price (in Rs.) | Points Gained | Points Lost |
| 1 | 102 | 2 | 0 |
| 2 | 104 | 2 | 0 |
| 3 | 108 | 4 | 0 |
| 4 | 104 | 0 | 4 |
| 5 | 101 | 0 | 3 |
| 6 | 105 | 4 | 0 |
| 7 | 104 | 0 | 1 |
| 8 | 109 | 5 | 0 |
| 9 | 111 | 2 | 0 |
| 10 | 108 | 0 | 3 |
| 11 | 109 | 1 | 0 |
| 12 | 112 | 3 | 0 |
| 13 | 115 | 3 | 0 |
| 14 | 116 | 1 | 0 |
| Total = 27 | Total = 11 |
Points gained or lost is the difference between the closing price of today and the closing price of yesterday. If the value of the difference is positive, we count it as a point gained. If it is negative, we count it as a point lost. However, the value of point lost as well is expressed in positive in the chart.
Now lets calculate RSI using the formula we mentioned above.
RSI = 100 – (100/1+RS)
Where RS = Average Gain / Average Loss
Average Gain is calculated by dividing the total number of points gained by the period, which in this case is 14 days.
Average Gain = 27/14 ~ 1.93
Average Loss = 11/14 ~ 0.78
RS = 1.93/0.78 ~ 2.47
Hence, RSI = 100 – (100/1+2.47) ~ 71.2
The value of RSI for the 14-day period comes out to 71.2, which means the market is overbought and a correction may be expected. However, for many cryptocurrencies that constantly touch the 70 mark on RSI may need the overbought level to be adjusted a bit. Similarly, if a cryptocurrency yields an RSI value below 30 on a consistent record, the oversold limit may need an adjustment specifically for that cryptocurrency.
Time to learn what a chart with RSI looks like:
Notice that the chart here is a regular trading chart with historical data plotted. The red line below represents RSI values plotted for a 14-period. The line of RSI runs in the same chart with the upper limit being 100 and lower limit being 0.
Few things that you need to know about RSI:
- If RSI values are above 70 for too long, it may not mean a correction and a trader must not trade with a decline or reversal in mind, because staying above 70 for too long may also mean the momentum is too high. Hence, one must be very careful and observant of the price values if RSI is above 70 for many days. Same goes for RSI staying below 30 for a prolonged period due to very low momentum, which may not pick up in the coming days and may even result in further decline.
- Just as the RSI value starts moving again after staying in an overbought zone for too long, traders must prepare for shorting as it may be an indicator of the market reaching saturation from being oversold. Similarly, if the RSI values start moving again after staying in the oversold region for too long, this may be a good sign for traders to go long.