
|
Getting your Trinity Audio player ready...
|
Double Bottom
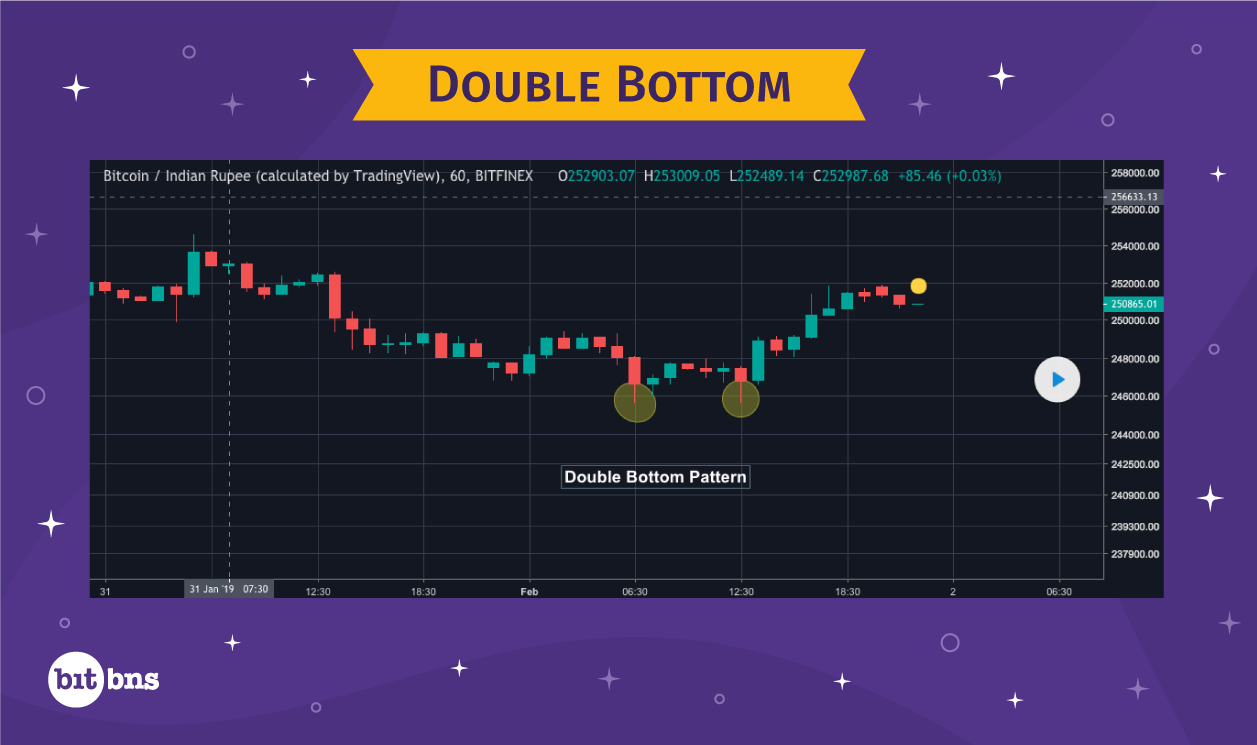
A Double Bottom is a bullish reversal pattern, which is marked by the formation of two trough-like structures at the bottom with a peak-like structure in the middle. What happens during a double bottom formation is that the price hits a particular low level, rebounds forming a peak, hits approximately the same previous low, and then rebounds again. After the rebound happens, the double bottom is confirmed, and one must trade keeping the bullish sentiment in mind. The peak-like structure in the middle that shows price recovery must hold for 2-3 weeks and then the price must fall again.
Double Top
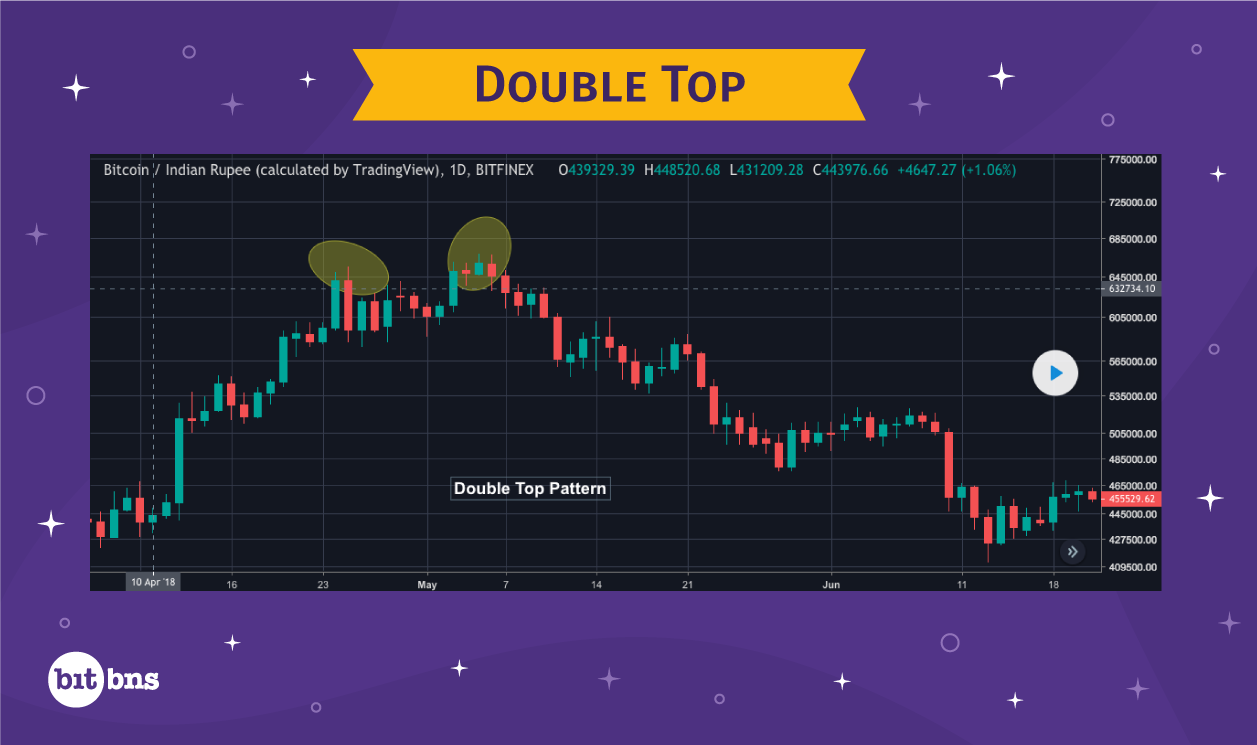
The formation of a Double Top is quite similar to that of a Double Bottom, except that the former is a bearish reversal pattern. In case of a Double Top, there are two peak-like structures at the top with a trough-like structure in the middle. During a double top, prices hit a new peak, fall to low levels to hold there for about 2-3 weeks, form a new peak at approximately the same price level as that of the first peak, and then rebound to bring in the bearish sentiment. Remember, the last rebound after the second peak is important to confirm the trend. Beyond that, traders must trade assuming that the bearish sentiment is in play.
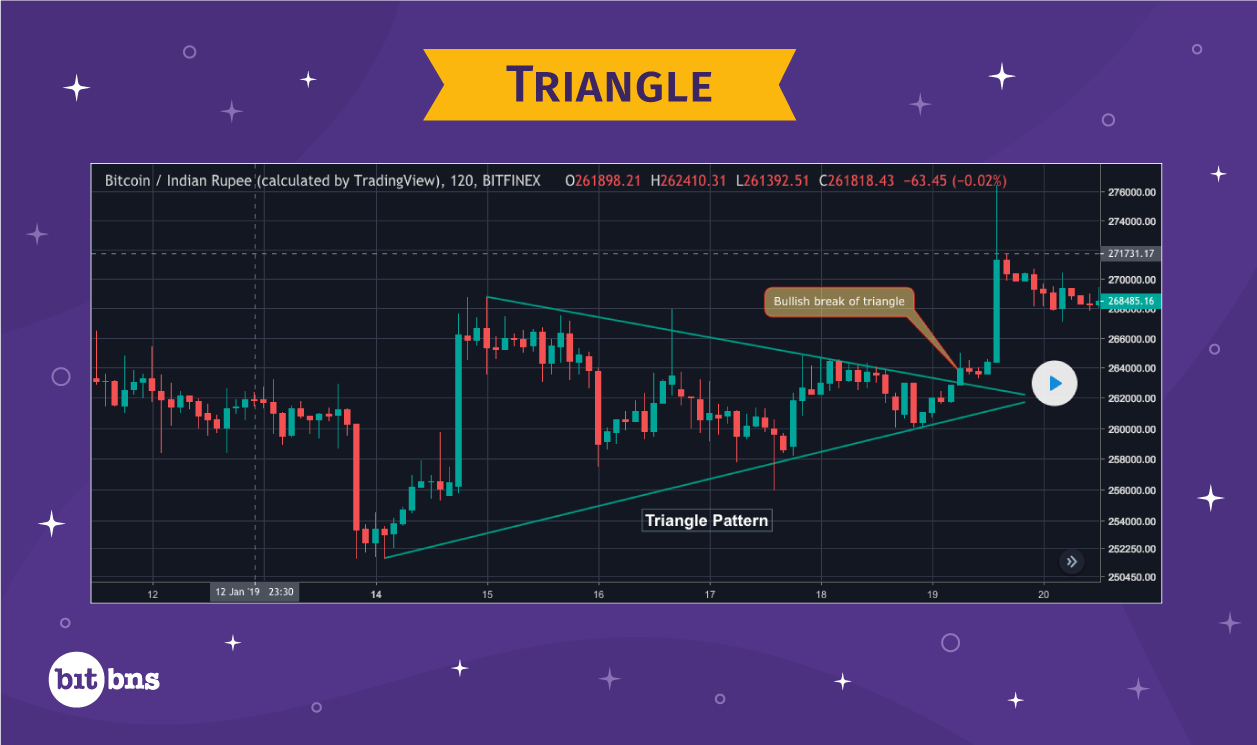
Flag and Pennant or Triangle
https://in.tradingview.com/chart/BTCINR/gC89w3t4-BTC-Flag-Pattern/
(Flag)
A Flag is a trend continuation pattern that derives its name from the way it looks. Similar to the flag, Pennant gets its name from the shape of a tapering flag, also called Pennant. The sharp price movement preceding the flag/pennant formation is called the Flag Pole.
A Flag or Pennant is formed when there is a sharp price movement with a steep slope, followed by sideways congestion or a slight fall/rise in the price movement. When there is sideways congestion, a flag is formed, whereas a pennant is formed when there is a slight fall/rise in the price.
The flag or pennant formation is followed by another sharp rise, which brings a great trading opportunity as the follow up is reasonably sharp to yield profits. The length of the rally or fall succeeding the flag/pennant formation, starting from the base of the pattern, is considered equal to the flag pole’s length. Thus, it becomes quite simple for one to predict the target price when these patterns are spotted.
Head and Shoulders
Head and Shoulders Top is quite a strong bearish reversal pattern and appears after an uptrend. It comprises three peaks – the highest being in the middle and the other two being on either side of the mid-peak.
The position of the peak makes this pattern look like head and shoulders, where head is the highest peak in the middle and the other two are the shoulders. The trend line joining the lows of the shoulders is called the neckline, which also acts as a support level, which changes to resistance after the trend is reversed. The slope of support determines how aggressive the reversal is going to be. Please note that the presence of uptrend before the formation of this pattern is necessary.
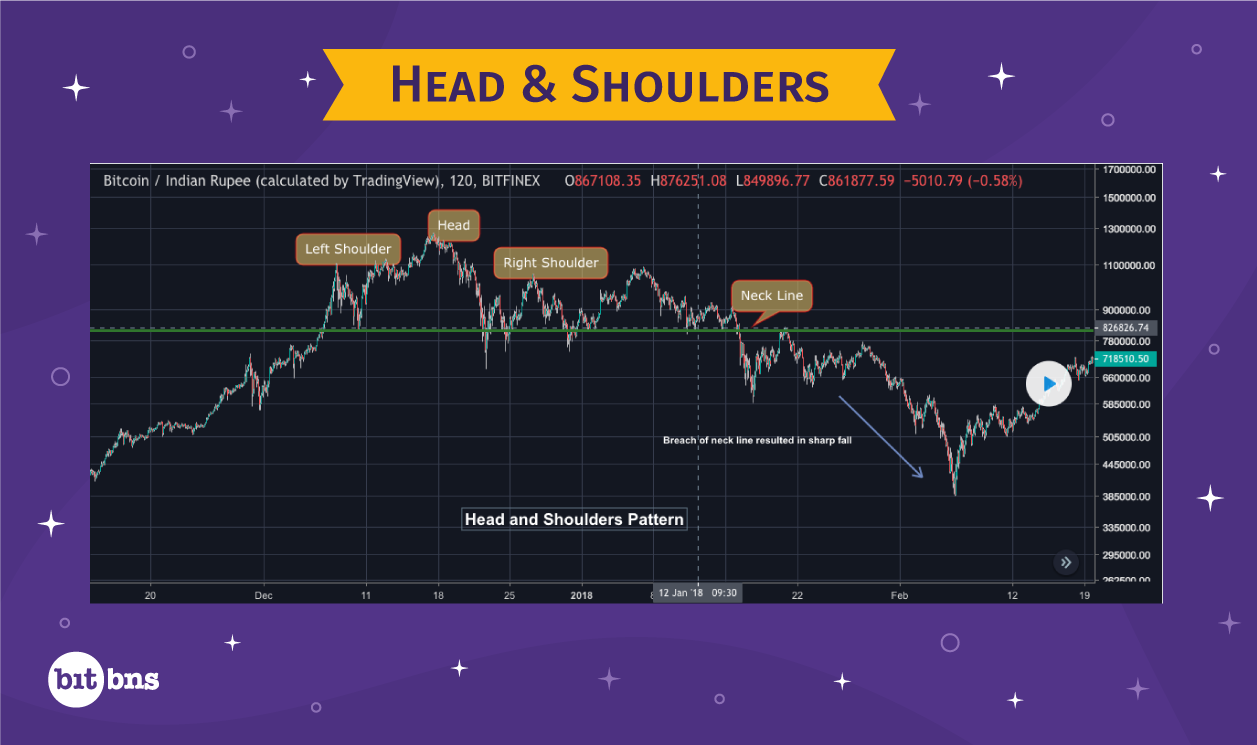
Volume is one of the main indicators for the formation of this pattern. There is a noticeable difference between the trade volumes during the advances of the left shoulder and the head, with the left shoulder having more volume. Apart from the head formation, reduction in trade volume during the advance, followed by an increase in the volume during the decline of the right shoulder is a clear indicator. However, a break of the neckline is an important confirmation that traders look for.
Estimation of target price is quite easy for sellers at this point. The distance between the head of the pattern and the neckline break is added to the neckline break point to find a target price.
Inverse Head and Shoulders
A strong bullish trend reversal, Head and Shoulders Bottom is almost a mirror image of a Head and Shoulders Top. In this pattern as well, there are three successive peaks that take the shape of a head in the middle and two shoulders, one on each side of the head. The head forms the lowest point in the pattern, with shoulders being approximately on the same level. Formation of a bullish head and shoulders essentially happens after a downtrend.
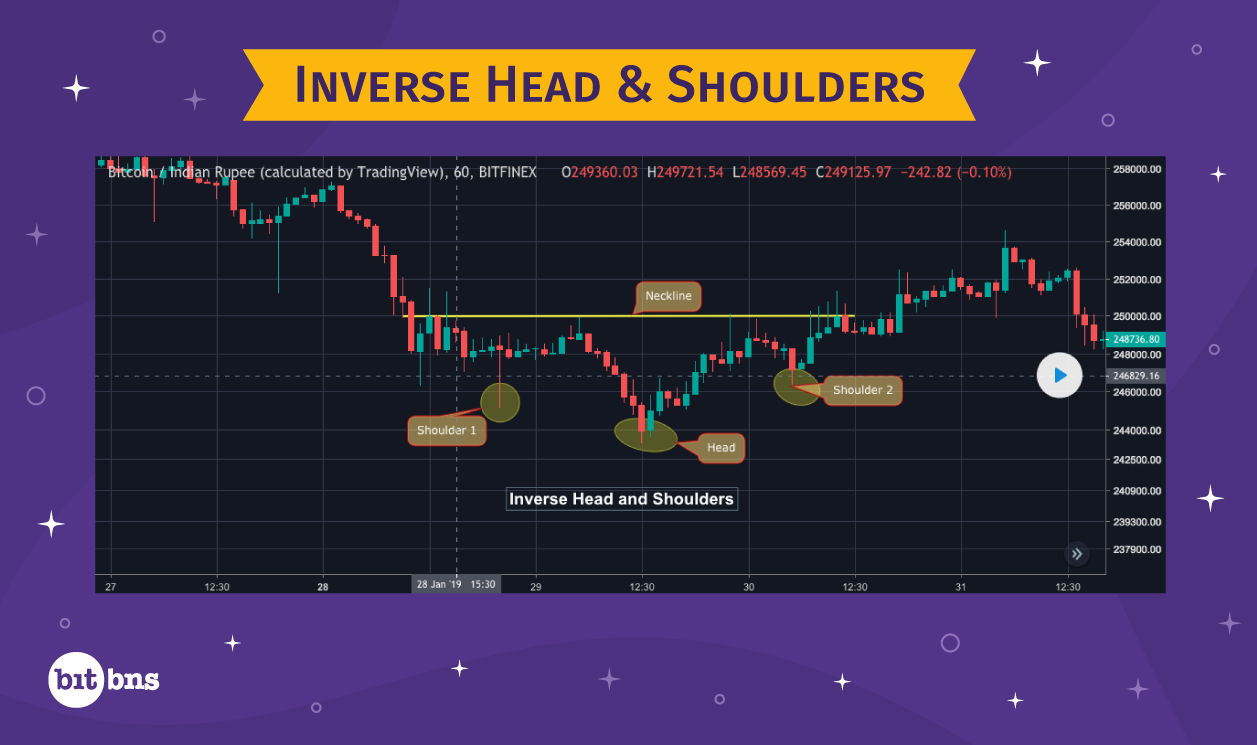
The two highs of the shoulders are joined to form a resistance level, the slope of which exhibits the degree of bullish trend reversal. After the reversal happens, the resistance level is broken and the same level continues to act as a support for the upcoming price movements.
The change in volume has to be monitored in order to read the market correctly. As the price declines to form the left shoulder, the volume increases substantially, which may continue during the decline that forms the head. The subsequent rise after the formation of the head shows an increase in volume. Now comes the most crucial part, which almost acts as a confirmation – the expansion in volume during the advance after the formation of the second shoulder low. The pattern is considered complete when the neckline or resistance is broken, which is the right moment to buy.
Estimation of target price is quite easy for buyers who enter at this point. Generally, the distance between the head of the pattern and the neckline break is added to the neckline break point to find a target price.