
|
Getting your Trinity Audio player ready...
|
Regardless of whether you are a technical analyst, an investor, or a day trader, candlestick patterns are something that you will always use. Technically, there are two types of candlestick patterns based on the number of candlesticks they are made of – single candlestick patterns and multiple candlestick patterns.
Let’s begin with Single Candlestick Patterns.
Single Candlestick Patterns
Marubozu
Marubozu is a Japanese term that translates to bald or shaved. A Marubozu pattern is probably the easiest to find in the candlestick charts because it looks longer than a normal candlestick, minus the upper and lower wicks.
Marubozu candles are of two types – Bullish Marubozu and Bearish Marubozu.
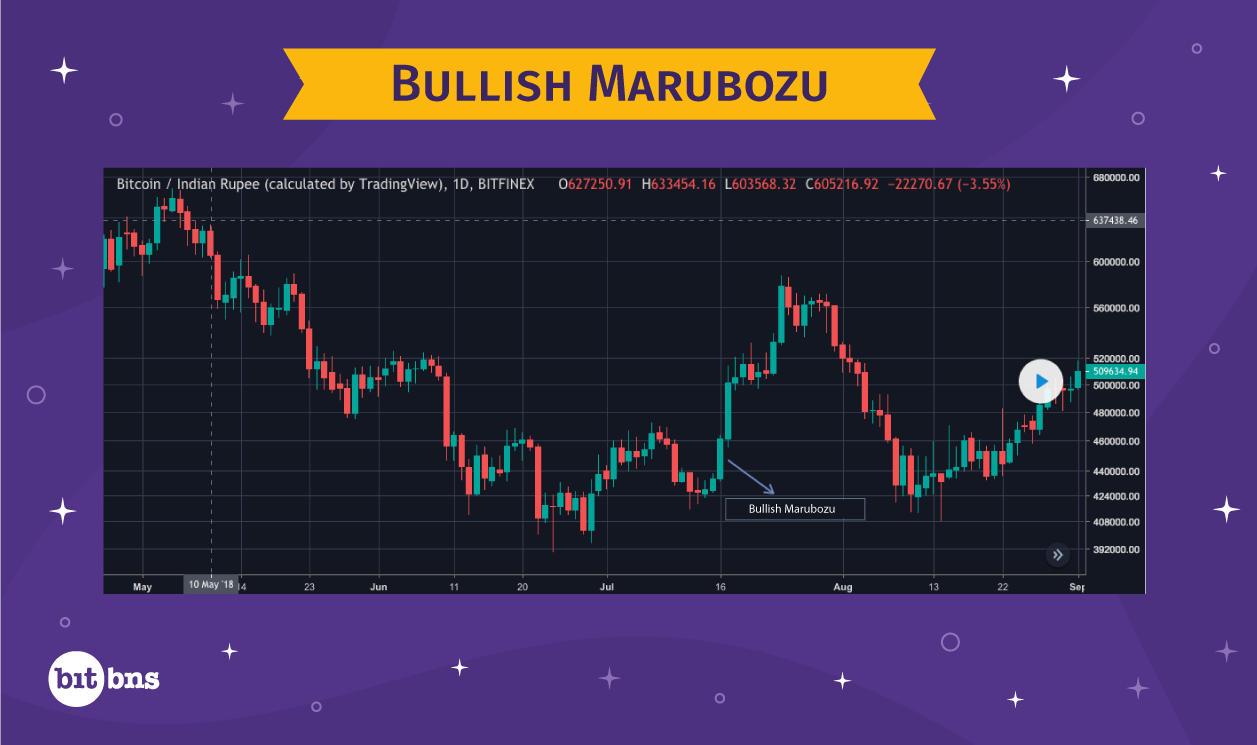
Bullish Marubozu
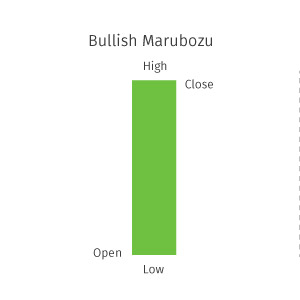
Bullish Marubozu candles can appear anywhere in the chart with a very specific meaning. The lack of the ‘High’ and ‘Low’ shadow in a Bullish Marubozu denotes that the market opened at ‘Low’ and closed at ‘High’, which means the market was quite bullish and stayed that way the entire day. The intensity of bullishness in the market is directly proportional to the length of the Marubozu candle. The longer the candle, the more bullish the market has been.
There are few assumptions tagged to the Bullish Marubozu candle that you must know:
If it appears at the end of an uptrend, it signals that the trend will continue to be bullish.
If it appears at the end of a downtrend, expect a trend reversal.
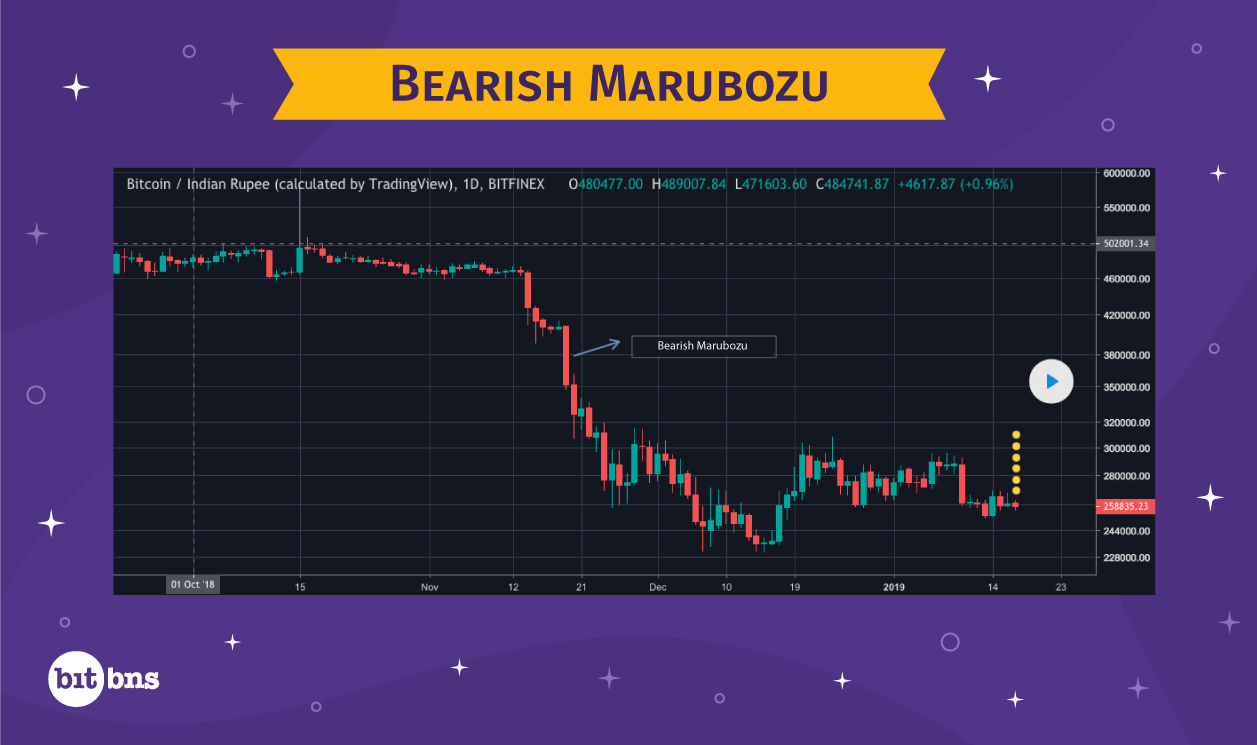
Bearish Marubozu
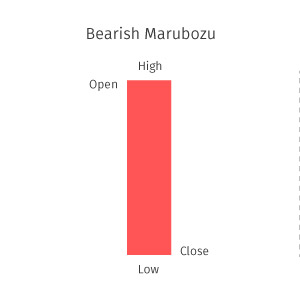
Bearish Marubozu candle looks similar to Bullish Marubozu, except that it has a different colour and it represents that the market opened at ‘High’ and closed at ‘Low’. Just like its Bullish counterpart, Bearish Marubozu can also be spotted anywhere in the charts and represents that the market has been quite bearish and has had intense selling pressure.
With Bearish Marubozu as well, there are two assumptions:
- If it appears at the end of a downtrend, the trend is most likely to continue.
- If it appears at the end of an uptrend, you may see a trend reversal.
Doji
A Doji candlestick is also among the simplest ones to spot. With a nil or negligible body, Doji candlesticks will always have a lower shadow, an upper shadow, or both. Since it does not have a real body (signifying that the open and close price points are almost the same), but does have an upper or lower shadow, a Doji candlestick points towards ambiguity in the market, which may ultimately lead to trend reversal. Ambiguity among traders means lesser trade activity.
Based on the shadow a Doji candle bears, a Doji candlestick is of three types:
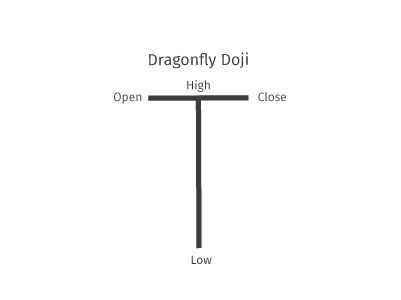
Dragonfly Doji
When a Doji has a long lower shadow but no upper shadow, we are looking at a Dragonfly Doji. A Dragonfly Doji indicates a bullish reversal.
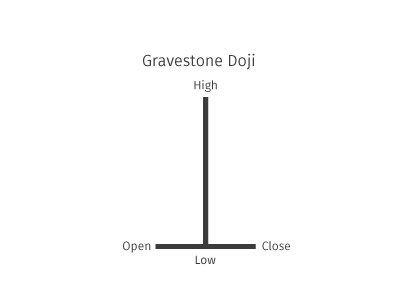
Gravestone Doji
A Doji with a long upper shadow but no lower shadow is a Gravestone Doji, which is a warning for bearish reversal.
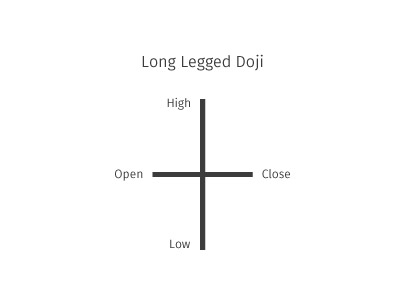
Long-legged Doji
Long-legged Doji are formed when both the upper and lower shadows of candlestick are long enough. Long-legged Doji indicates a strong reversal in trend, which means the prices may shoot up or take a dip depending on the existing trend.
Spinning Tops
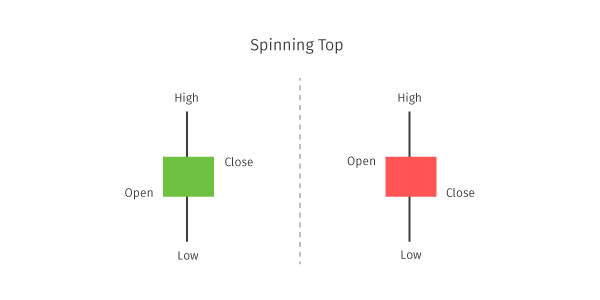
Spinning Tops are called so because of what they look like. Resembling a spinning top toy, this pattern is marked by candlesticks with long upper and lower shadows and a very small body. Can you guess what it represents? Yes, it represents ambiguity among buyers and sellers as the short body represents less intense trading activity, but then long shadows show that the market is indecisive. Traders are everywhere to comprehend the right price which is why the trend may take a U-turn. Hence, Spinning Tops at the end of any trend may as well be a sign of reversal.
https://in.tradingview.com/chart/BTCINR/eVZVmgKo-BTCINR-Spinning-Top-Pattern/
But never rush to invest with a trend reversal in mind because the market is indecisive so it may continue the trend as well.
Hammer
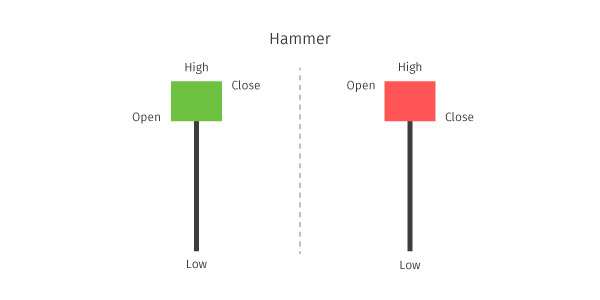
A Hammer is formed when a candlestick has no upper shadow, has a significantly long lower shadow, and the body is almost a third of the lower shadow. The body has to be located at the upper end of the trading range at the end of the downtrend.
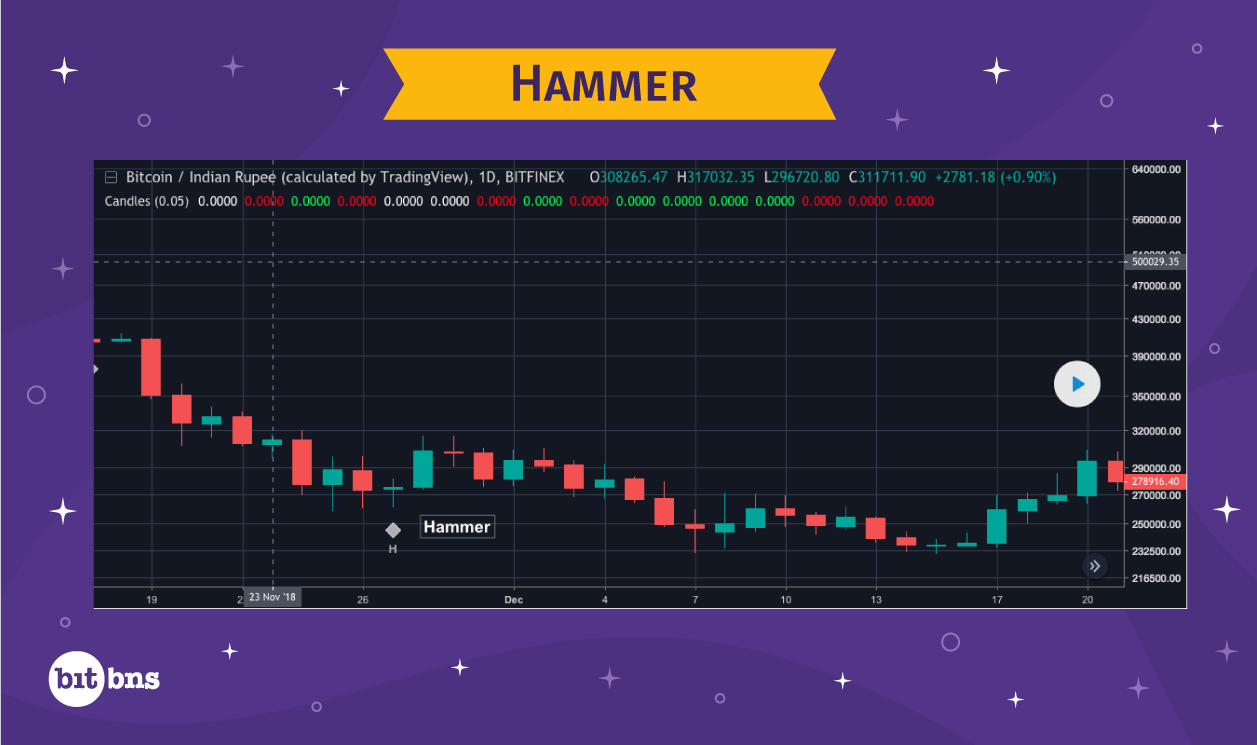
The formation of a hammer signifies that the bears have been in control, until the bulls showed enough strength to rope-in a bullish reversal. Hence, a hammer always occurs at the end of a downtrend and reverses the trend. The longer the lower shadow, the more struggle it represents for the bulls trying to take over the bears.
Hanging Man
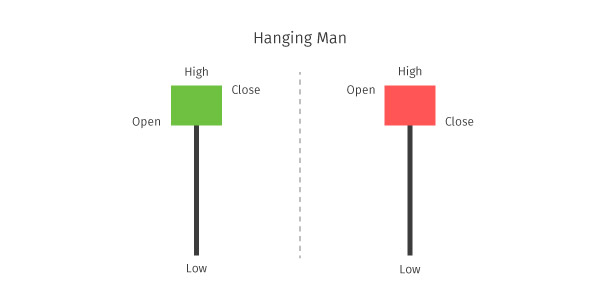
A Hanging Man pattern is easy to identify as it resembles a man suspended in the air. Check out what it looks like:
As you can see the upper shadow is absent, a long lower shadow is present and the body is almost a third of the lower shadow. Talking about its occurrence, a Hanging Man is found at the end of an uptrend and signals a bearish trend reversal. Since the figure shows how, after a sustained uptrend, bears come in to take over bringing down the price prominently, following which the bulls put up a fight to bring the price all the way up and close it there. However, the bulls fail to stop a trend reversal because the bears win at showing dominance.
(insert chart) https://in.tradingview.com/chart/BTCINR/RLL0J89J-Hanging-Man-BTC/
Shooting Star
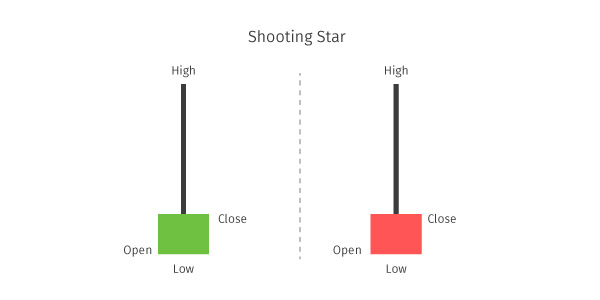
Shooting Star is a bearish candlestick, which looks the same as an inverted hammer. However, not to be confused, a shooting star is formed at the end of an uptrend, whereas an inverted hammer is formed at the end of a downtrend. So while an inverted hammer is a bullish candlestick pattern at the bottom of the chart, shooting star is a bearish candlestick pattern found at the top of the chart.
The formation of shooting star implies that the bulls have been trading during an uptrend and a normal bullish candlestick had to form.
As you can see in the figure above, the price was already pumped to form a higher high. But at this point, the bears entered the market and steered the price down. Bulls react to this trade activity and close the price movement slightly higher than the previous high, but not as much as it should have been if the trend would have continued. Since bears won the tug-of-war, the uptrend was reversed.
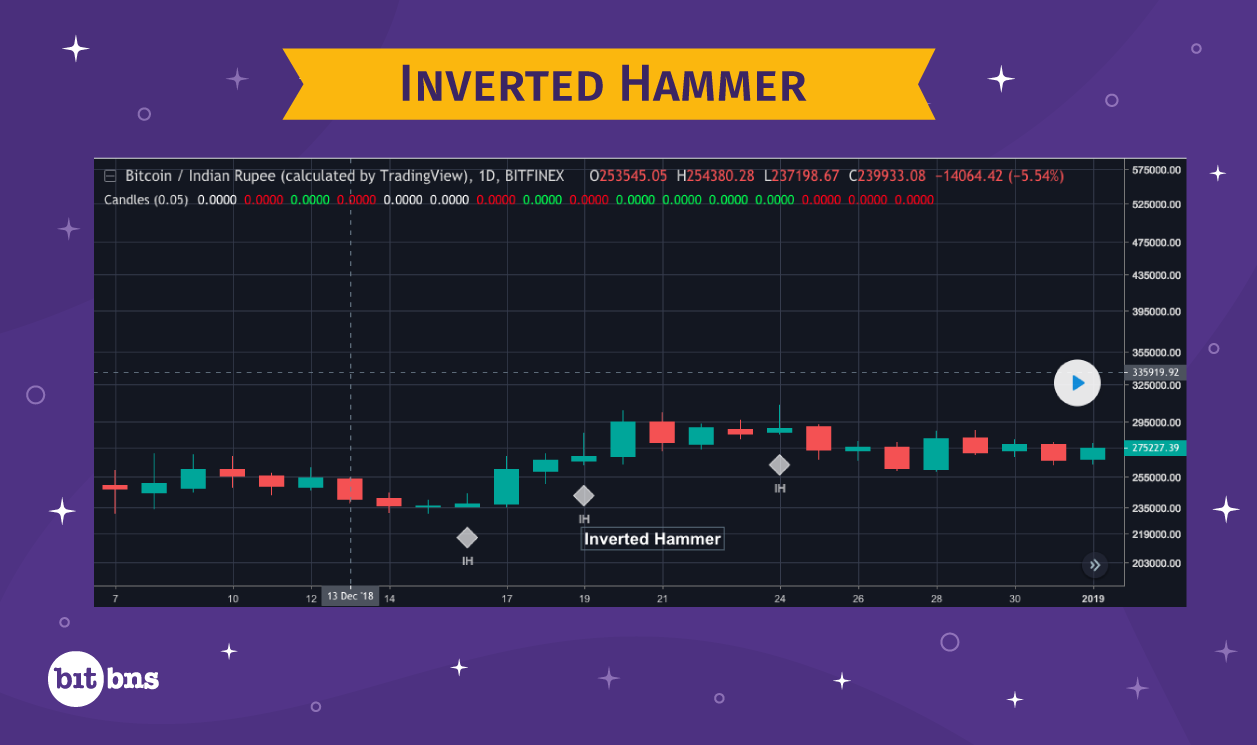
The market psychology behind the formation of inverted hammer is the same, except that in this case,
WIth that, we come to the end of single candlestick patterns. Give yourself a pat on the back and get ready for the advanced multiple candlestick patterns.
Multiple Candlestick Patterns
Bearish Engulfing Pattern
A bearish engulfing pattern is formed with two candlesticks – one bullish and one bearish. Before I go on and explain what it is, have a look at the chart and see what you understand.
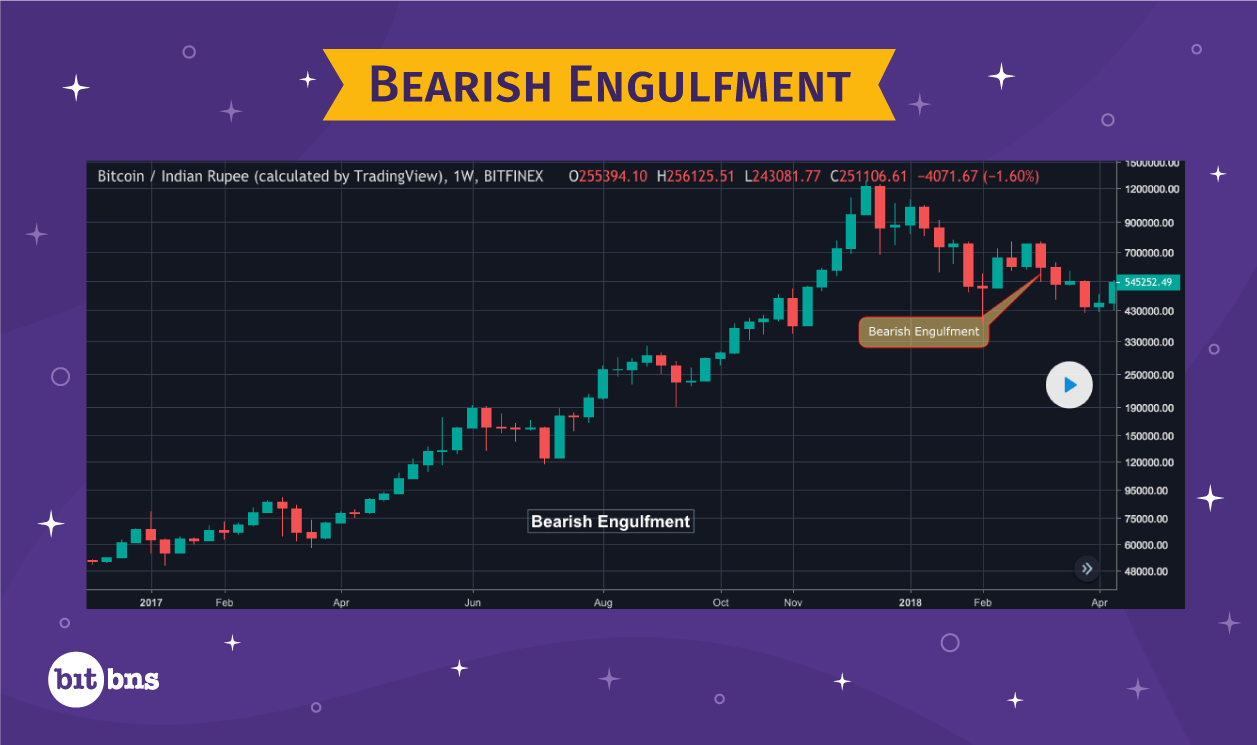
If you think the bearish candlestick on the right engulfed the bullish candlestick on the left, you are absolutely right.
For a bearish engulfing pattern to occur:
- A bullish and a bearish candlesticks are present at the end of an uptrend.
- Bearish candlestick forms after the bullish candlestick, and both the candlesticks may or may not have upper and lower shadows.
- Open of the bearish candlestick needs to be more than the close of bullish, and the close of the bearish candlestick must be less than the open of the bullish candlestick.
A bearish engulfing pattern appears during an uptrend. Bulls have complete control over the market and the market opens at a higher price each day. So, like a routine session during uptrend, the market opens at a higher price than the previous candlestick, expected to close at a higher price. As expected, the price movement does reach a higher high. But at this point, informed bears see that the prices have almost touched the ceiling for the run, and consequently, the bullish trading activity has decreased. This is the time when they enter the market and create a surge in selling pressure, due to which, even after reaching a higher high, the market retracts to a lower low and closes at a lower price than the previous bullish candlestick. This shakes the bulls, who now look forward to exiting their positions expecting a trend reversal, which fuels the trend reversal. The most aggressive type of trend reversal case is seen during a bearish engulfing pattern, when another pattern suggesting uncertainty in the market shows up. It could be a Long-legged Doji or a Spinning top, among which Doji is more powerful than Spinning Top at asserting uncertainty.
Unlike in a quick trend reversal where bulls holding on to their assets in a hope for prices to recover, uncertainty provides bulls with a window to exit, thus ensuring a trend reversal.
Bullish Engulfing Pattern
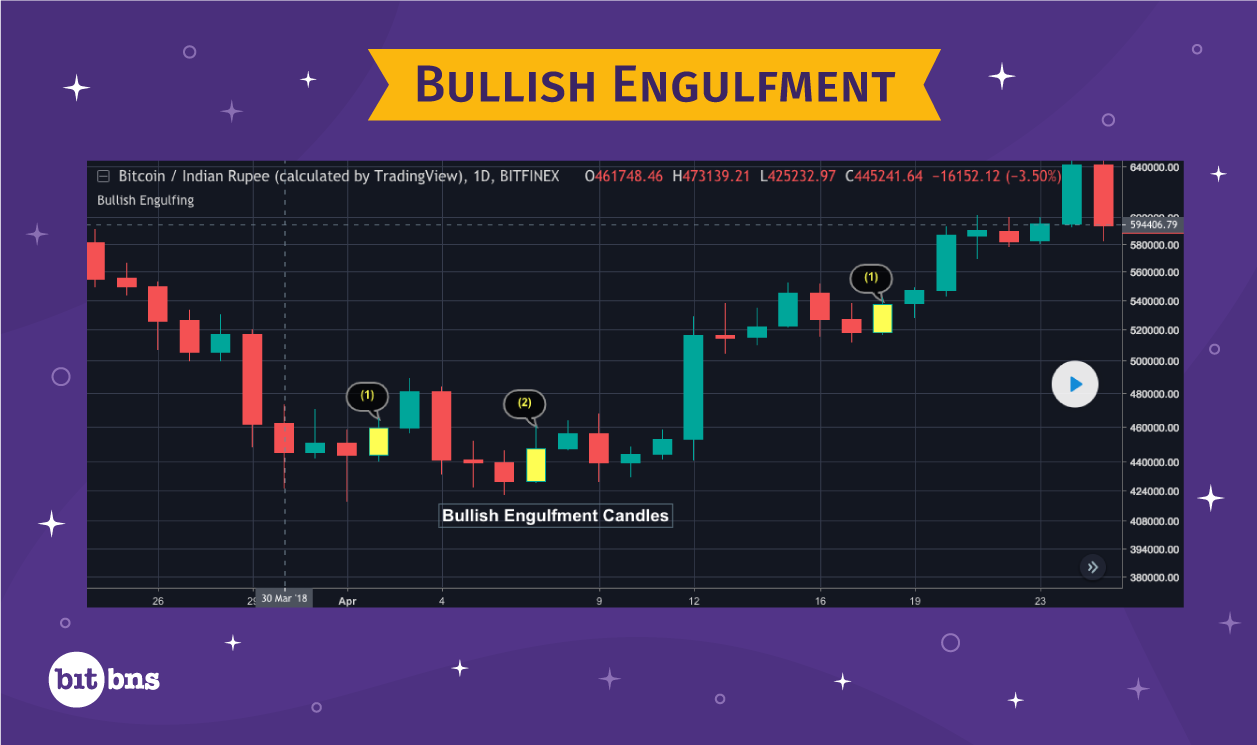
Bullish Engulfing Pattern is the exact opposite of the Bearish Engulfing Pattern. It is made up of two candlesticks – one bearish and the other bullish. I am putting up a chart here and I am pretty sure you already understand what is going on here:
Yes, in this case, the bullish candlestick engulfed the bearish one, which is the exact opposite of what happened in the bearish engulfing pattern.
You can say you have spotted a bullish engulfing pattern when:
- A bullish and a bearish candlesticks are present at the end of a downtrend.
- Bullish candlestick forms after the bearish candlestick, and both the candlesticks may or may not have upper and lower shadow.
- Open of the bullish candlestick needs to be less than the close of the bearish, and the close of the bullish candlestick must be more than the open of the bearish candlestick.
The occurrence of a bullish engulfing pattern happens during a full-fledged downtrend. The bears are the dominant force in the market and as usual the downtrend leads to the market opening at a lower opening price. The market looks quite bearish at this moment. However, at the same time, the bulls see the price low enough to qualify as a good buying opportunity because the prices are low. So, even though the market opens lower than the close of the last candlestick, the bulls create buying pressure and take the market to a price point higher than the opening of the previous bearish candlestick. This delivers a blow to the bears, powerful enough to make them exit the short positions that they had maintained to profit from deeper dips. Once the bears sell their positions, bulls take over with a greater force, thus enforcing a strong trend reversal. The most notable aspect about this pattern is that the bulls completely dominate the bears, which is why the bullish reversal is almost certain.
Whenever a bullish engulfing pattern is followed by a Long-legged Doji or Spinning Top, the trend reversal is boosted even more.
Harami
Hold up before you sue me for startling you with sudden indecency. Harami pattern is just another multiple candlestick pattern, which involves two candlesticks. It’s a Japanese word, which means pregnant. This kind of pattern is known to occur at the end of a trend and brings indecision followed by either sideways congestion or complete reversal. If you pay attention, you can see that the second candlestick almost looks pregnant with the first candlestick. Yes, that is where Harami gets its name from.
Bearish Harami
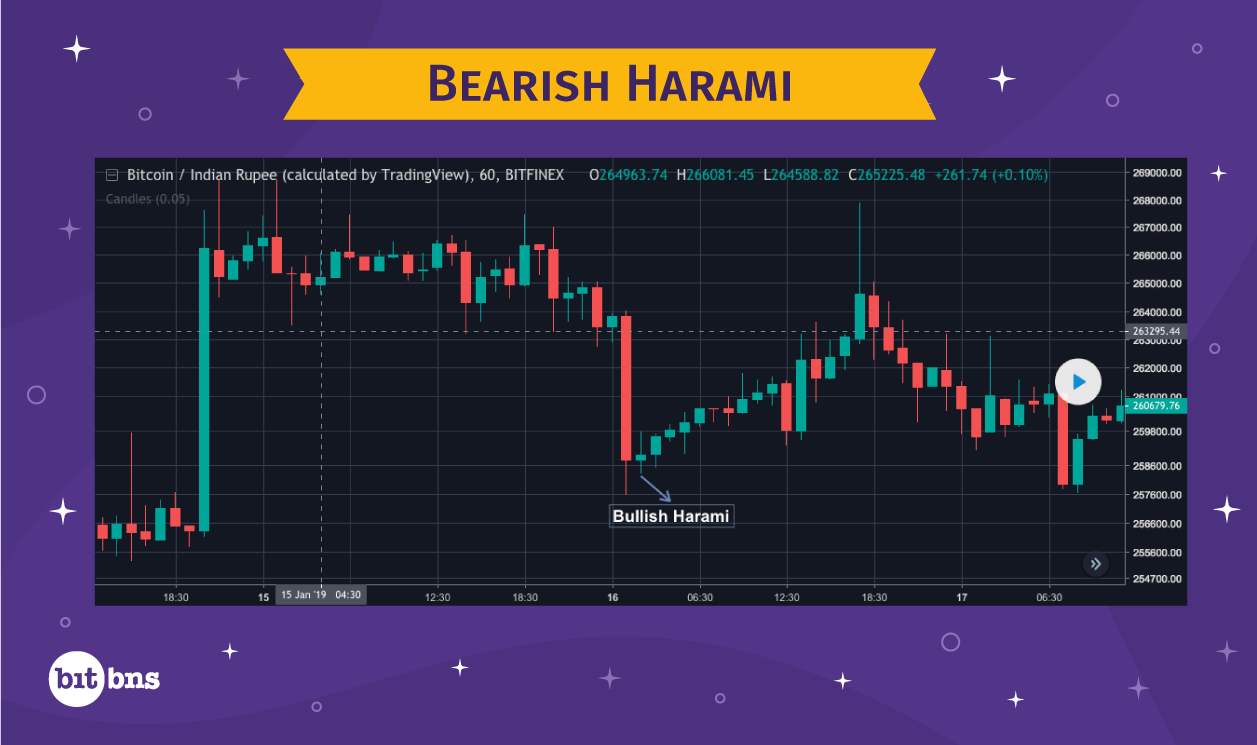
A Bearish Harami pattern occurs at the end of an uptrend and causes either sideways congestion or a bearish reversal. A Bearish Harami pattern is:
- Present at the end of an uptrend.
- Made up of two candlesticks – one long, one short. The range of the short one is completely engulfed by that of the long one. Both the candles may or may not have high and low.
- The first candlestick is essentially bullish and the candlestick that follows may be red or green signifying the intensity of trade activity.
Right before the Bearish Harami candlestick is formed, the market looks completely bullish. The bulls are keeping the market up and the buying action is strong, which is evident from the next candlestick displaying trade activity at higher price. However, this is also the point where bulls cannot push the prices further up as a consequence of which the intensity of trading activities is reduced. Hence, the next candlestick formed has a smaller body. Beyond this point, you already know what happens; ambiguity and indecision. This leads to sideways congestion. At this point, short traders start taking positions and bulls sell their positions, which fuels the situation even more, causing a trend reversal when both the price actions are strong.
Bullish Harami
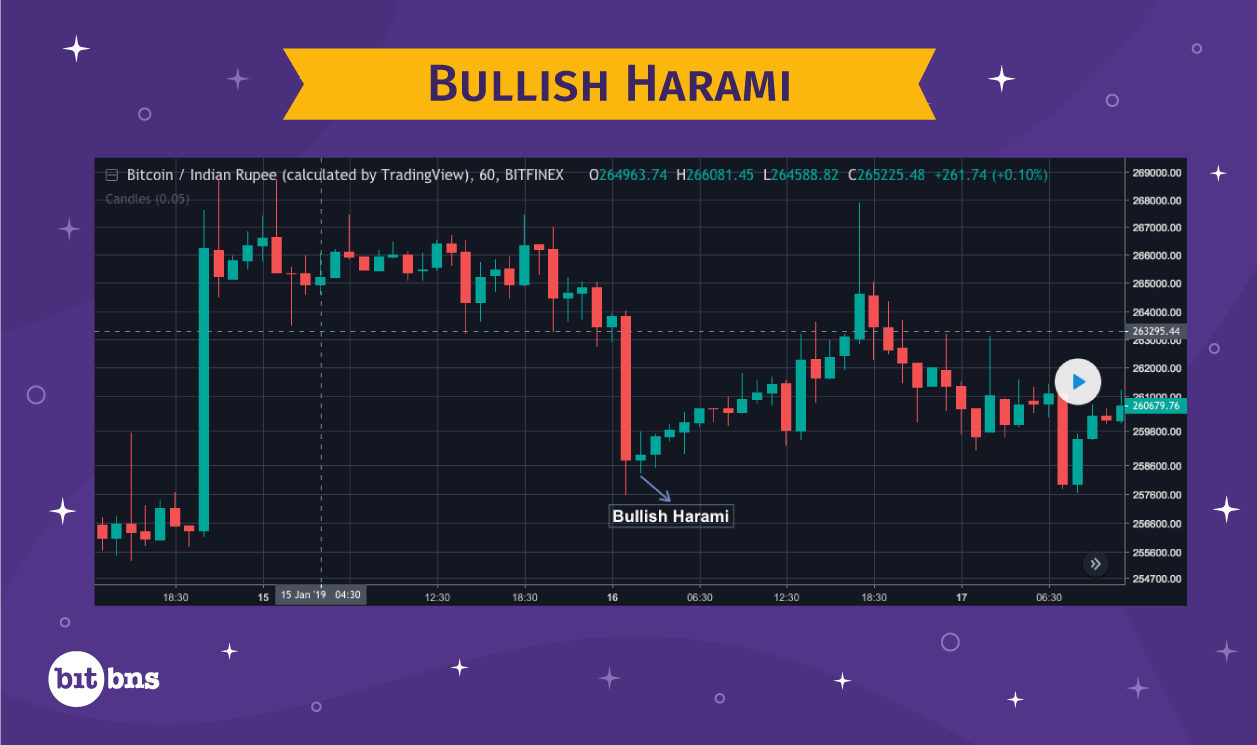
A Bullish Harami pattern occurs at the end of a downtrend and does the same thing as its bearish counterpart; indecision. Following are the characteristics you can identify a Bullish Harami pattern with:
- Present at the end of a downtrend.
- Made up of two candlesticks – one long, one short. The range of short one is completely engulfed by the range of long one. Wicks are not necessary.
- The first candlestick is essentially bearish and the short candlestick could be red or green depending on the degree of trade activity.
Bullish Harami is marked during a strong downtrend. The market at this point is quite bearish. Accelerated selling leads to lower lows as you can see in the chart. But then, the trade activity reaches a point where bears cannot sell for any lower and bulls smell that. The struggle between bulls and bears is real, which leads to sideways congestion which is apparent by the next smaller body candle. Although the high and low of both the candles may be present, the trading activity is reduced as both sides are not sure about the prices. However, bulls emerge as a stronger force, making short-traders exit their positions. This is the time when bulls assume long positions boosting the onset of the uptrend.
Piercing Line
There is a reason why the piercing pattern is called so; it shows bulls piercing through the confidence of bears. I am pretty sure that, by now, you have understood that the piercing pattern is a bullish reversal pattern.
Here is what a piercing pattern looks like:
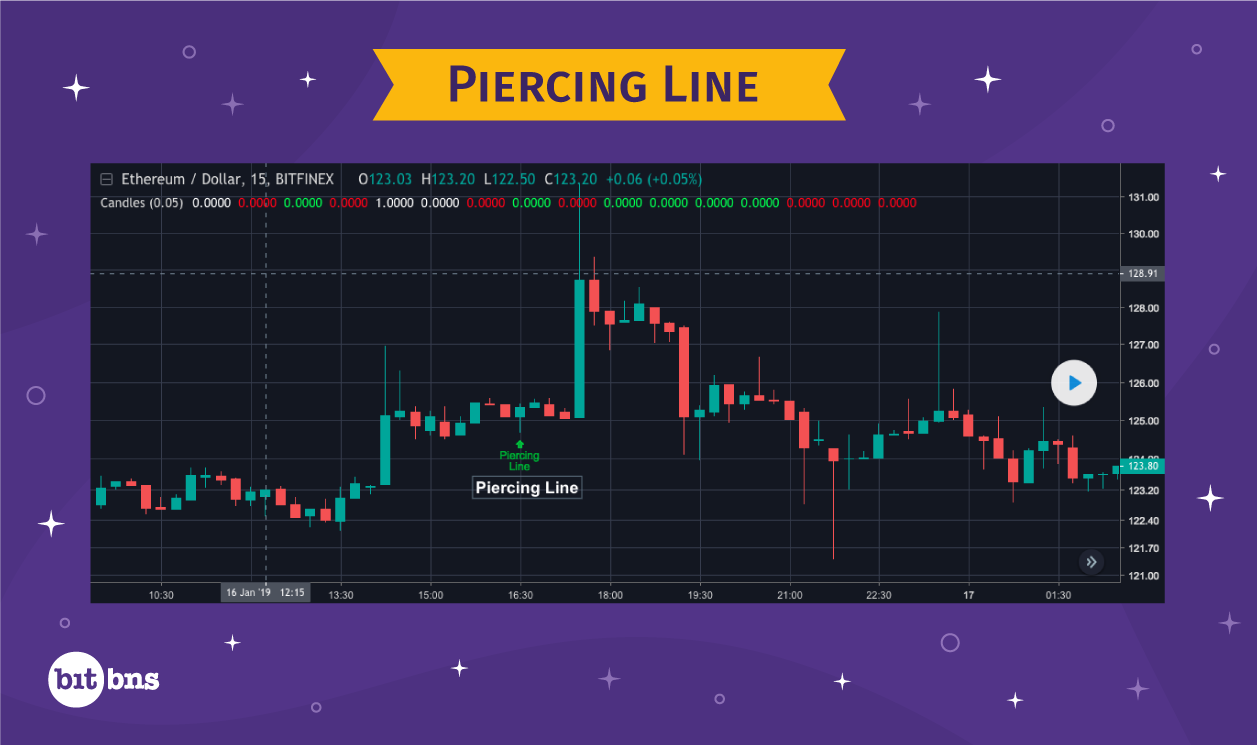
Piercing pattern, comparatively, is a little complex that other patterns. Before you assert that you are looking at a piercing pattern, make sure that:
- There are two candlesticks – the first one is bearish and the second is bullish.
- The close of the bullish candle has to be above the mid-point of the bearish candle’s body. The open of the same could be anywhere below the close of bearish candle.
Let’s talk about what this pattern means. The market is very bearish as apparent from the bearish candle that also shows that the selling activity is quite high. However, the prices have fallen so much by now that the selling further is not a part of the plan for bears. Prices in this phase rope in the bulls, who cause a rally to close the price above the mid-point of the last bearish candle. Remember that the close of the next candlestick crossing the mid-point of the previous bearish candlestick is crucial for this pattern to form. If this condition is not met, it is not a pattern.
The new rally shakes up the confidence of the bears leading them to exit their positions, adding to the confidence of bulls. Confirmation of this pattern depends on the price of the next open.
Dark Cloud Cover
Dark Cloud Cover is the exact opposite of the piercing pattern. Known to cause a bearish trend reversal, the Dark Cloud Cover is also made up of two candles: a bullish candle followed by a bearish candle. Here is how it looks:
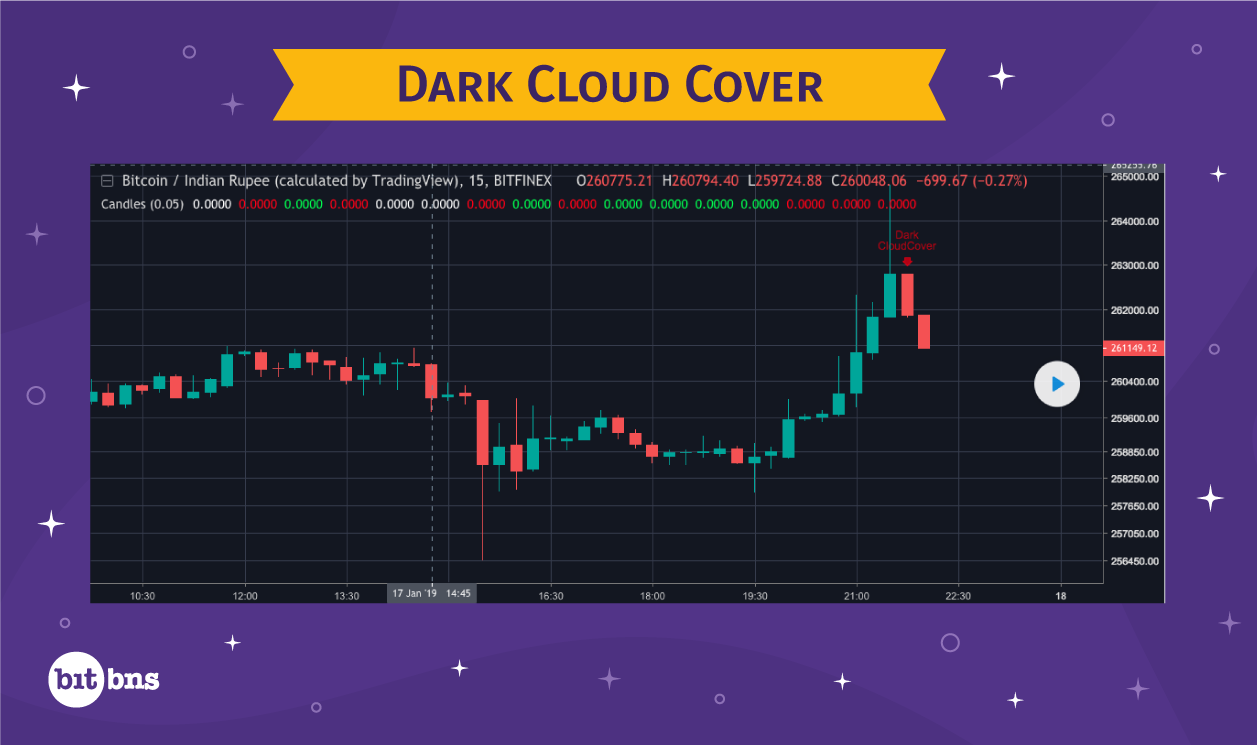
To identify a Dark Cloud Cover, you must note whether or not:
- There are two candlesticks – the first one is bullish and the second is bearish.
- The close of the bearish candlestick must be below the mid-point of the bullish candle. The open of the same could be anywhere above the close of the bullish candlestick.
The psychology that this pattern represents is that the market has a pretty good uptrend, but at the same time, has reached saturation for the bulls in terms of price. The bulls are no longer willing to purchase at such high prices, which tables an opportunity for the bears to enter the market. The bears enter the market with great force and the bias is slightly in favour of the bears, who have been looking forward to taking position once the market stalls. The market opens normally, above the previous close, but this time, only to be brought down by the bears. Dragging the market down to the mid-point of previous candlestick and below, is a big blow to the bulls. As the trend confirms with the market opening below the close, the rest of the bulls exit their positions and the downtrend continues.
Morning Star
The Morning Star is quite self-explanatory in itself as the morning star represents the dawn of an uptrend. Essentially a bullish reversal pattern, the Morning Star appears at the bottom of a downtrend and is made up of three candlesticks in the following order – a bearish candle with a long body, a bullish/bearish candle with a small body, and a bullish candlestick with a long body.
First in the order, the bearish candle is a continuation of the downtrend. The second candle has a short body formed well below the close of the previous bearish candle. The third candle, which is bullish, forms well above the body range of the second candle.
A Morning Star pattern looks like:
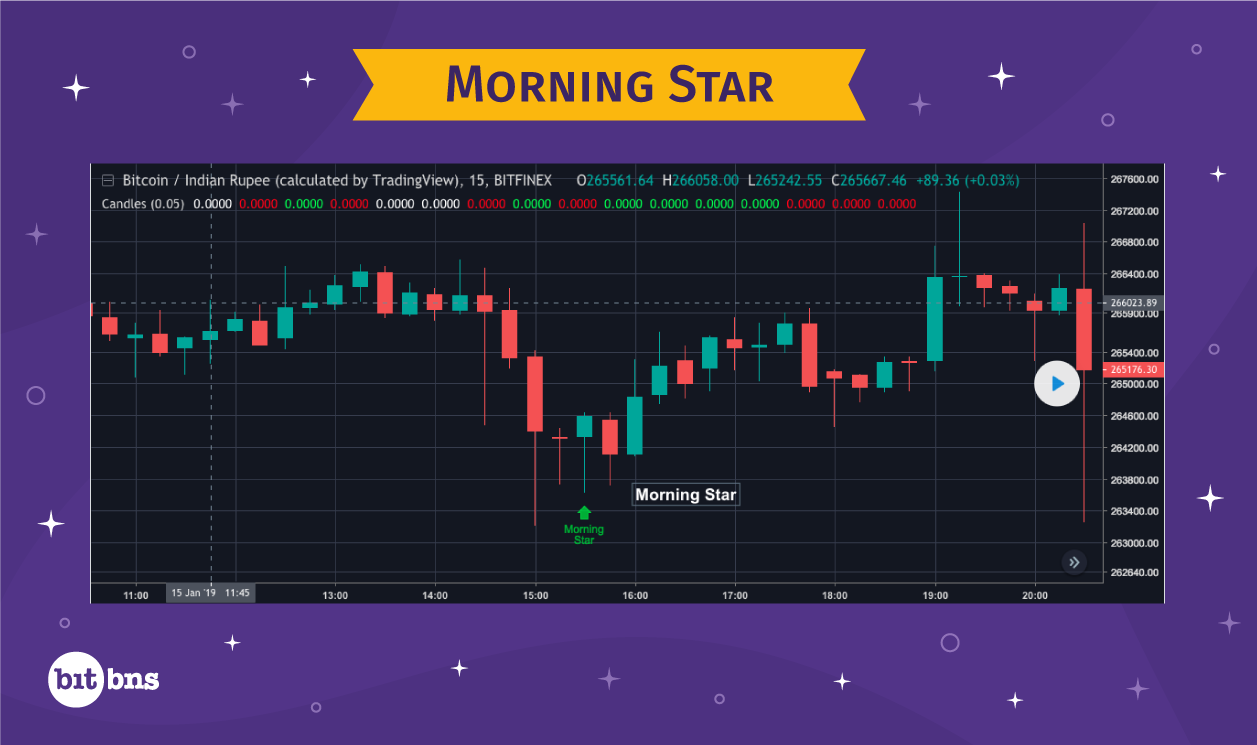
The market psychology reflected by the pattern is that the bears are continuing the downtrend, which is apparent by the formation of the first, long-body candle. At this point, the market sentiment is quite bearish. However, the short body of the second candle indicates loss of momentum in the selling activity, or in plain terms, slight indecision. Bulls see an opportunity here and start taking long positions, opening the market above the range of the second, short-body candle. Bulls may or may not be able to close the market above the open of the first candle, which is fine and the pattern would still count as a Morning Star. The strength of the reversal depends on the closing price of the third candle; the longer the body, the stronger the reversal.
Evening Star
Just like the Morning Star causes a bullish trend reversal, Evening Star appears at the top of an uptrend and causes a bearish trend reversal. The evening star is also made up of three candles. The first one is a long-body bullish candle, which is followed by a short-body bullish/bearish candle. The third one is again a bearish long-body candle.
The first candle, as expected, continues the uptrend. The second short-body candle forms well above the previous bullish candle. The third candle has to form well below the second candle, representing a complete bearish reversal.
Taking into account the specifications mentioned above, here is a picture of the evening star pattern:
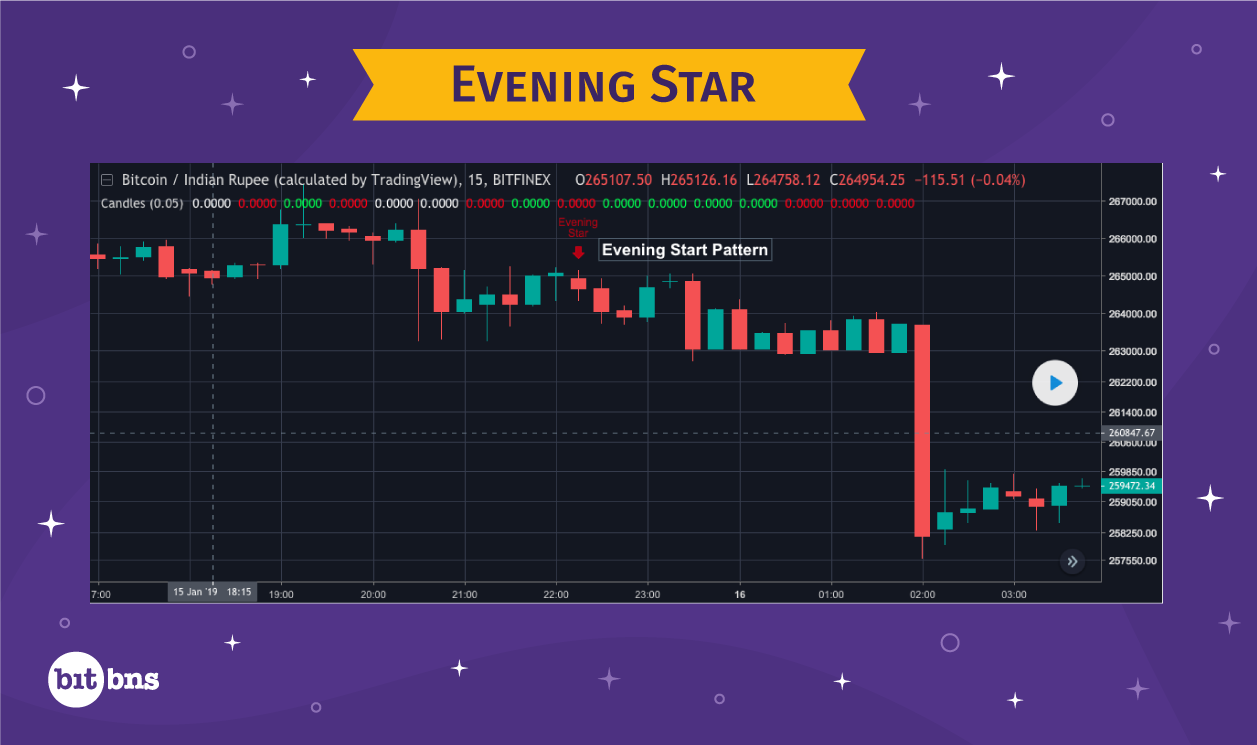
Let’s see what the market psychology in this case is. The market is bullish and formation of higher highs is consecutive as usual. This is clearly visible in the first candle, which is bullish and has a long body, signifying great momentum in buying activity. However, the trend reaches a point where bulls cannot sell at higher prices, which happens due to market saturation. Consequently, trading activity from buyers’ side weakens and the bears start to catch up. During this phase, there is vast indecision among traders, which justifies the weakened trade activity shown by the second candle with a short body. Something to be noted here is that the second candle is not a hanging man as the length of lower shadow is not twice or more of its own body. The formation of a second candle shakes the confidence of bulls and this is the moment for bears. As the pattern is confirmed by the third candle, bearish reversal happens. The length of the third body, which is bearish, is directly proportional to the strength of bearish reversal.