

|
Getting your Trinity Audio player ready...
|
The most common term linked to Technical Analysis, today or a hundred years back, is Dow Theory. Unlike most of the concepts, especially theoretical ones, Dow Theory did not lose its relevance and is still recommended by technical analysts to understand the market.
The theory was extracted and formulated from the editorials written by Charles H. Dow between 1900 to 1902, which represents Dow’s beliefs on how to read the signs in the stock market and talks about ways to determine the health of the economy with market analysis. Although Dow never got the chance to publish the complete theory due to his death in 1902, many experts and associates published their own version of Dow’s interpretation of the market, like The Stock Market Barometer by William P. Hamilton, The Dow Theory Today by Richard Russell, and many more.
The cause that led Charles H. Dow to put his theory in papers was his well-calculated belief that the stock market is a precise picture of the overall business conditions in the economy. So if one can analyse the market, they can be well-versed on the economic conditions, and the consequent stock market trends and direction of individual stocks.
Using his theory, Dow created two indexes that represent the two most important segments of the economy: Industrial Index and Rail Index (now known as Transportation Index). He did so because these two indexes represent almost everything about any economy.
The best thing about Dow Theory is that it only talks about analysing the market via price movements and does not have anything to do with the kind of asset the data belongs to. This makes Dow Theory applicable even in case of cryptocurrencies, and can be used to analyse the price behaviour of cryptocurrencies just like that in the stock market.
The timeless Dow Theory is practised by technical analysts across the world, and in order for you to master it, learning the six basic tenets of it is a must.
Let’s see what they are:
Price Discounts Everything
We have already discussed this section in the assumptions of Technical Analysis. But just for the sake of maintaining a flow, I will discuss what the first tenet of Dow Theory means.
‘Market Discounts Everything’ simply means that any information at any point of time about any company – be it statistical, numerical, or sentimental – is priced into its stock units. In order to predict the direction of the stock market, one does not need to look at the fundamental information of a company, as everything they are looking for is factored into the price of its stocks. The only information that is not accurately reflected in the stocks are external events like natural calamities, rather represented in the form of risk, which is also well-distributed among the stocks.
The point in Dow Theory is that an investor can identify trends by figuring out patterns in the stock market data, and decide where their money should go.
The Market has Three Trends
Before we talk about the three trends, let us understand what a trend is. A trend is an ongoing condition in the stock or cryptocurrency market, where a particular type of trade is encouraged and the other is discouraged. For example – if the market has an upward price trend, traders will be encouraged to buy a cryptocurrency with prospects of selling it at a higher price. Opposed to that, a market with a downward price trend would encourage sellers to sell their positions due to the falling prices.
As Dow Theory has a major emphasis on price movements in broad markets, learning to identify trends becomes a crucial part of technical analysis.
Delving deeper, the movement of a market driven by any type of trend, if plotted on a graph or chart, does not look linear, and is rather broken down into rallies. One complete rally consists of a peak and trough, where peak is the highest and trough is the lowest point in the rally, when observed over a specific time period. No matter where the peaks and troughs are formed, if we are talking about an ongoing trend, the market is necessarily unidirectional.
Direction of Trends
Now that you understand the manner in which the market moves, let us talk about the two major directions of a trend, which are:
Uptrend:
When we say there is an upward trend or uptrend in the market, we mean that in each rally, the peak is higher than the previous peak and the trough is higher than the previous trough. This kind of observation is also called Higher Lows. As long as higher highs and lows keep coming in succession, we can be sure that the uptrend is maintained. An uptrend means that underlying demand for the asset is strong and buyers are willing to pay higher prices for it.
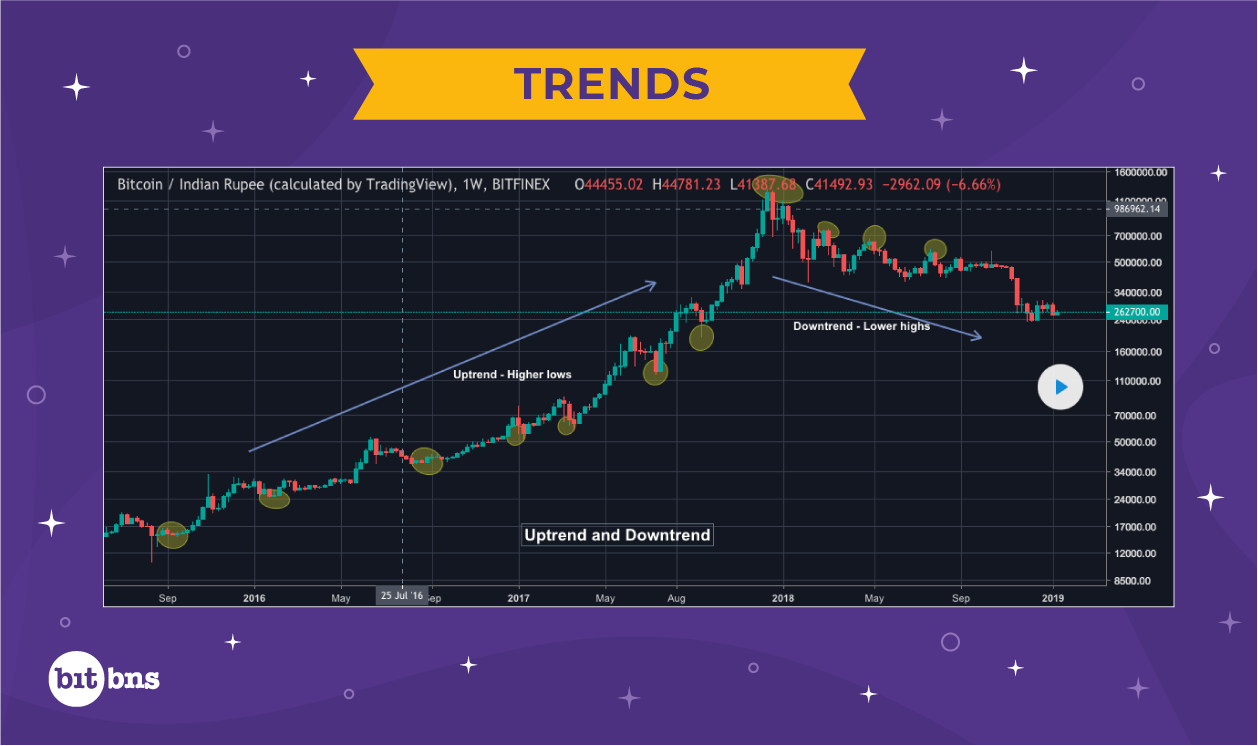
Downtrend:
The exact opposite of an upward trend is a downward trend or simply downtrend. If, in each rally, the peak is lower than the previous peak and the trough is lower than the previous trough, and this is happening in a successive manner, we are looking at a downtrend. A downtrend means underlying demand for the asset is weak and sellers are willing to pay lower prices to exit the asset.
Having discussed the direction of a trend, let’s now talk about the types of trends. According to Dow Theory, there are three types of trends in stock or cryptocurrency market:
Types of Trends
Primary Trend
The most important and most eyed trend in the cryptocurrency market is a Primary Trend. The longest trend in the market, primary trend may last for years. Simply put, a primary trend is the direction in which the market is moving. However, spotting the commencement or conclusion of a primary trend is quite challenging as it is difficult to predict how long it would go on before a trend reversal knocks. Also, the signs of reversal are sometimes so subtle that they may be confused by an investor for a secondary trend. Hence, the most important aspect of this trend is timely identification to gain maximum profit by trading with the stream until the trend reverses.
Secondary or Intermediate Trend
Any primary trend is composed of secondary trends, which move opposite to the primary trend, or as a correction to the primary trend. Usually, a secondary trend moves the market in the opposite direction by one-third to two-thirds of the primary trend’s movement. For example – if the primary trend moves the market by 1000 points, the secondary trend may move the market in the opposite direction by 333 to 666 points.
In stock markets, a secondary trend lasts generally between three weeks to three months. However, in the case of cryptocurrency markets, there is no definite time period for secondary trends due to difference in volatilities of assets. Hence, secondary trends in a cryptocurrency market are generally spotted from a monthly timeframe with no fixed durations.
At times, a series of secondary trends may look like a trend reversal, but it is possible to determine whether it is actually a trend reversal or just retracement from a secondary trend. In case of primary upward trend, a secondary trend would show a movement of consecutive higher highs to consecutive lower highs, whereas in a primary downward trend, a secondary trend would change the movement from lower lows to higher lows. Now in order to differentiate between trend reversal and retracement, an analyst has to pay attention to both the duration of the movement and the magnitude of it.
For example – if in a primary uptrend, the point change in a rally is more than 2/3 of the latest rally and this goes on consecutively or in frequent intervals for more than a couple of weeks, a trend reversal may be setting up. If both the criteria indicating trend reversal are not fulfilled, it may be just a secondary trend.
However, something to be noted is that we cannot predict the trend with utmost surety because TA may fail in some cases.
Minor Trend
Usually, in stock markets, a trend that lasts approximately for less than 3 weeks is a minor trend. In cryptocurrency markets, this period might be accelerated by a week or more. Minor trends are not very significant and the general motive behind a technical analyst looking out for a minor trend is to profit via arbitraging, intra-day trading, or short-selling. But this is where they generally go wrong because they start to see a chance in almost an ephemeral trading opportunity. Directing all attention towards minor trends may not be a wise approach to trade during minor trends. So, it is recommended to stay sharp about the primary and secondary trends when trading during a minor trend.
Primary Trends have three phases
Primary trends age just like us; they age in phases. Each type of primary trend, the primary uptrend and the primary downtrend, has three phases.
Let us see what the lifecycle of a primary uptrend like:
Accumulation Phase
The first phase of a primary trend is the accumulation phase, and like it sounds, the primary trend just starts to accumulate during this phase. This is the time when the market has seen enough blows and the fall has almost reached saturation. The perfect time for expert investors to invest, the prices are quite low and further fall is not expected. As a result, experts and informed investors enter the market during this phase. As the buying trend starts to catch up, downtrend starts to fade, which is apparent on the charts. By the end of the accumulation phase, prices reflect improvement.
Public Participation Phase
Like the comforting first light after a storm, the accumulation phase does its job of bringing investors out of their shelters. Once the public or general investors start participating, the public participation phase begins. This is the time when the price movements are at peak. There is a clear notion that the primary trend has been established completely, which encourages expert traders and analysts to hold their funds to sell at a higher price. So basically, nobody sells. They just buy.
Excess Phase
Everyone buys during the public participation phase. Everyone! So what do you expect would happen? Exactly, the market is overbought. At this point, the market is tense, and signs of weak trade start becoming prominent. Two kinds of price movements generally hint towards the Excess Phase – strengthening downward price movements and weakening upward price movements. Unfortunately, the last wave of buyers enters during this phase hoping to take home some profit from the uptrend, but that never happens as the price movements continue to dip. Simply put, excess phase marks the end of primary uptrend.
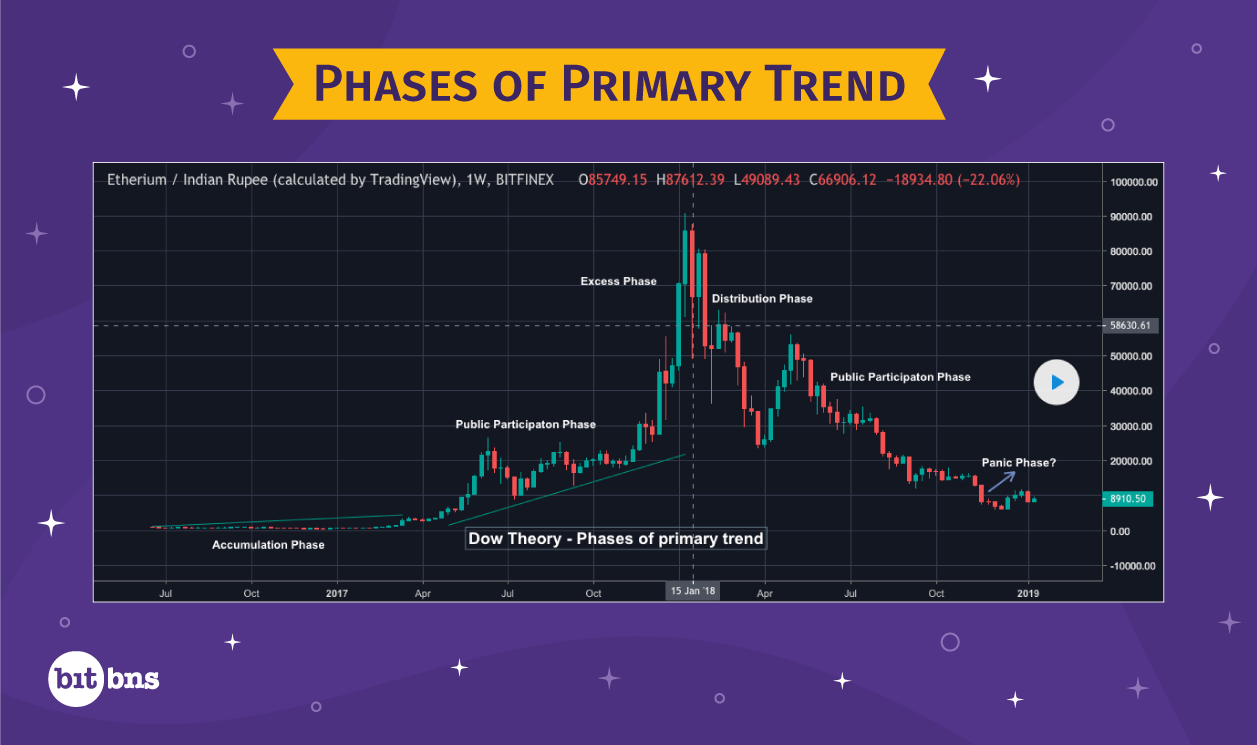
The end of primary uptrend marks the commencement of the primary downtrend. The excess phase slowly fades into the distribution phase of the primary downtrend. Similar to the primary uptrend, the primary downtrend has three phases:
Distribution Phase
The last phase of primary uptrend is the first phase of primary downtrend. Informed buyers sense the situation in advance and start selling. The generic investors, however, continue to buy as the sentiment is still bullish, with very weak to weak signs of trend reversal. By the time the distribution phase evolves into the next phase, signs of weaker selling become more prominent.
Public Participation Phase
As the participation phase makes its presence felt, downtrend is evident from increased selling. Largest price movements are seen during this phase. Experienced traders and technical analysts aggressively sell-off their positions as the downtrend is quite obvious by now, while beginners hold on, hoping for the market to change.
Panic Phase
Most part of the sell-offs during a primary downtrend happen during the panic phase. The market is overwhelmingly negative and in a short period of time, a huge fraction of the market is sold off, or in simple words, oversold. The completion of the panic phase is generally when most of the negative financial news has passed.
End of primary downtrend is the beginning of primary uptrend. The panic phase gradually changes shape into the accumulation phase of the primary uptrend. And the cycle goes on.
Markets must confirm each other (BTC ETH XRP)
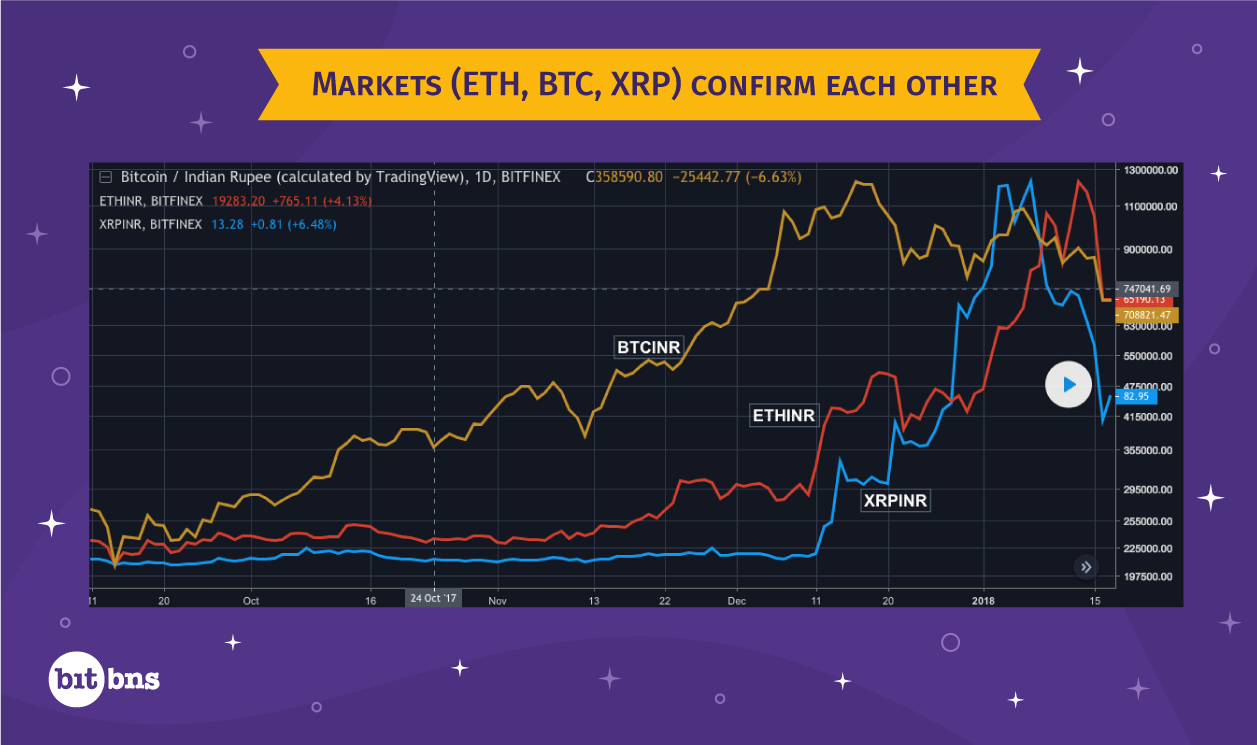
For cryptocurrency trading, we look at one primary index, which is made up of the market data sets of three major cryptocurrencies: Bitcoin (BTC), Ethereum (ETH) and Ripple (XRP). The reason why we count on these cryptocurrencies is that all three of these have gained major adoption over the years, pioneered what they do and have proven use cases that are already being used in different industrial sectors. Hence, one of the correct approaches to confirm a trend would be to look at the markets of BTC, ETH, and XRP and note if their trends confirm each other. However, minor trends of these cryptocurrencies may not be in sync with each other because cryptocurrencies are quite volatile assets.
Volume must confirm the trend
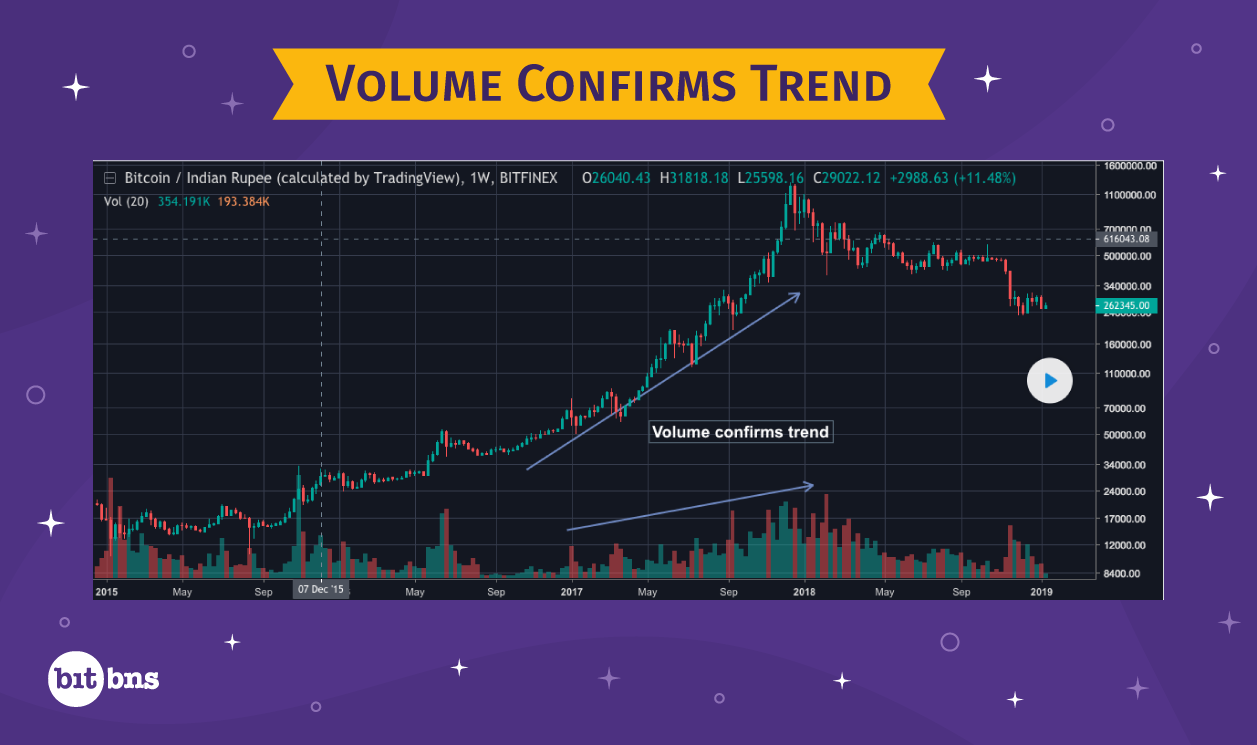
A trend means something that compels a large number of people to take more or less the same kind of decision. So when a trend is established in the cryptocurrency market, it compels a large number of traders to either buy or sell cryptocurrencies. And since a large number of people are buying or selling at the same time, the same must reflect in the volume as well. Hence, the volume for a particular cryptocurrency must increase when price movement is along with the direction of the trend, and decrease when the price movement is in the opposite direction. Anything other than this may signify a trend reversal. For example – increased volume during downtrend or decreased volume during uptrend may indicate a trend reversal.
A trend continues until a reversal is clear
The sixth and the last tenet of Dow Theory suggests that a primary trend continues until traders clearly spot a trend reversal. Most of the traders look for clear signs and make sure whether it is actually a trend reversal or just a secondary trend creating confusion.